

4.2 Spinel–Layered Coexistence Region
51
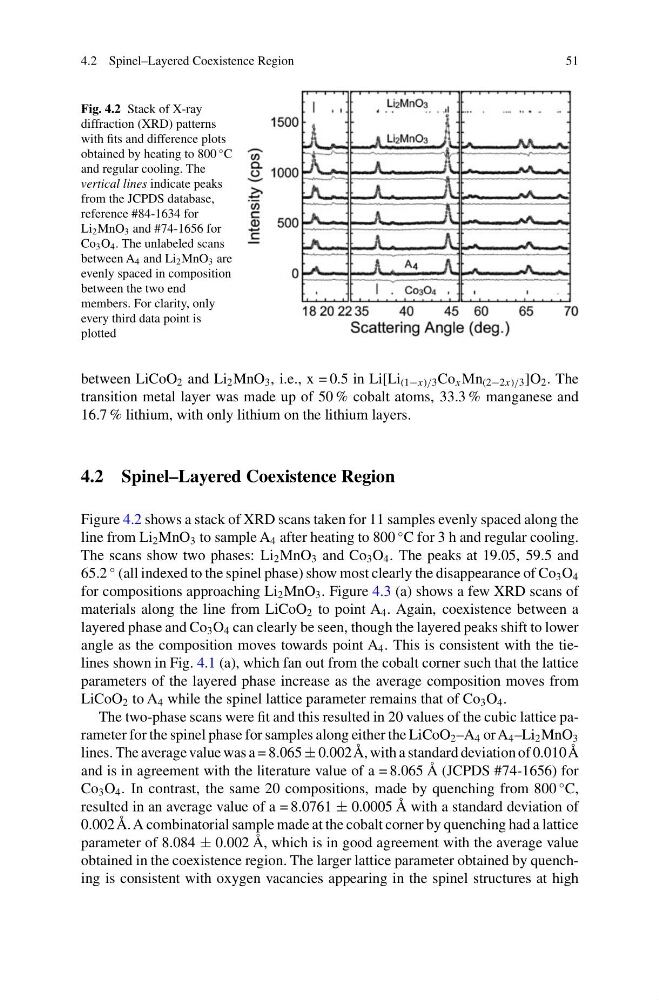
Fig. 4.2 Stack of X-ray
diffraction (XRD) patterns
with fits and difference plots
obtained by heating to 800
◦ C
and regular cooling. The
vertical lines indicate peaks
from the JCPDS database,
reference #84-1634 for
Li 2 MnO 3 and #74-1656 for
Co 3 O 4 . The unlabeled scans
between A 4 and Li 2 MnO 3 are
evenly spaced in composition
between the two end
members. For clarity, only
every third data point is
plotted
between LiCoO 2 and Li 2 MnO 3 , i.e., x = 0.5 in Li[Li (1−x)/3 Co x Mn (2−2x)/3 ]O 2 . The
transition metal layer was made up of 50 % cobalt atoms, 33.3 % manganese and
16.7 % lithium, with only lithium on the lithium layers.
4.2 Spinel–Layered Coexistence Region
Figure 4.2 shows a stack of XRD scans taken for 11 samples evenly spaced along the
line from Li 2 MnO 3 to sample A 4 after heating to 800
◦ C for 3 h and regular cooling.
The scans show two phases: Li 2 MnO 3 and Co 3 O 4 . The peaks at 19.05, 59.5 and
65.2
◦ (all indexed to the spinel phase) show most clearly the disappearance of Co 3 O 4
for compositions approaching Li 2 MnO 3 . Figure 4.3 (a) shows a few XRD scans of
materials along the line from LiCoO 2 to point A 4 . Again, coexistence between a
layered phase and Co 3 O 4 can clearly be seen, though the layered peaks shift to lower
angle as the composition moves towards point A 4 . This is consistent with the tielines shown in Fig. 4.1 (a), which fan out from the cobalt corner such that the lattice
parameters of the layered phase increase as the average composition moves from
LiCoO 2 to A 4 while the spinel lattice parameter remains that of Co 3 O 4 .
The two-phase scans were fit and this resulted in 20 values of the cubic lattice parameter for the spinel phase for samples along either the LiCoO 2 –A 4 or A 4 –Li 2 MnO 3
lines. The average value was a = 8.065 ± 0.002Å, with a standard deviation of 0.010Å
and is in agreement with the literature value of a = 8.065 Å (JCPDS #74-1656) for
Co 3 O 4 . In contrast, the same 20 compositions, made by quenching from 800
◦ C,
resulted in an average value of a = 8.0761 ± 0.0005 Å with a standard deviation of
0.002 Å. A combinatorial sample made at the cobalt corner by quenching had a lattice
parameter of 8.084 ± 0.002 Å, which is in good agreement with the average value
obtained in the coexistence region. The larger lattice parameter obtained by quenching is consistent with oxygen vacancies appearing in the spinel structures at high
51
Fig. 4.2 Stack of X-ray
diffraction (XRD) patterns
with fits and difference plots
obtained by heating to 800
◦ C
and regular cooling. The
vertical lines indicate peaks
from the JCPDS database,
reference #84-1634 for
Li 2 MnO 3 and #74-1656 for
Co 3 O 4 . The unlabeled scans
between A 4 and Li 2 MnO 3 are
evenly spaced in composition
between the two end
members. For clarity, only
every third data point is
plotted
between LiCoO 2 and Li 2 MnO 3 , i.e., x = 0.5 in Li[Li (1−x)/3 Co x Mn (2−2x)/3 ]O 2 . The
transition metal layer was made up of 50 % cobalt atoms, 33.3 % manganese and
16.7 % lithium, with only lithium on the lithium layers.
4.2 Spinel–Layered Coexistence Region
Figure 4.2 shows a stack of XRD scans taken for 11 samples evenly spaced along the
line from Li 2 MnO 3 to sample A 4 after heating to 800
◦ C for 3 h and regular cooling.
The scans show two phases: Li 2 MnO 3 and Co 3 O 4 . The peaks at 19.05, 59.5 and
65.2
◦ (all indexed to the spinel phase) show most clearly the disappearance of Co 3 O 4
for compositions approaching Li 2 MnO 3 . Figure 4.3 (a) shows a few XRD scans of
materials along the line from LiCoO 2 to point A 4 . Again, coexistence between a
layered phase and Co 3 O 4 can clearly be seen, though the layered peaks shift to lower
angle as the composition moves towards point A 4 . This is consistent with the tielines shown in Fig. 4.1 (a), which fan out from the cobalt corner such that the lattice
parameters of the layered phase increase as the average composition moves from
LiCoO 2 to A 4 while the spinel lattice parameter remains that of Co 3 O 4 .
The two-phase scans were fit and this resulted in 20 values of the cubic lattice parameter for the spinel phase for samples along either the LiCoO 2 –A 4 or A 4 –Li 2 MnO 3
lines. The average value was a = 8.065 ± 0.002Å, with a standard deviation of 0.010Å
and is in agreement with the literature value of a = 8.065 Å (JCPDS #74-1656) for
Co 3 O 4 . In contrast, the same 20 compositions, made by quenching from 800
◦ C,
resulted in an average value of a = 8.0761 ± 0.0005 Å with a standard deviation of
0.002 Å. A combinatorial sample made at the cobalt corner by quenching had a lattice
parameter of 8.084 ± 0.002 Å, which is in good agreement with the average value
obtained in the coexistence region. The larger lattice parameter obtained by quenching is consistent with oxygen vacancies appearing in the spinel structures at high