

50
4 Combinatorial Studies in the Li–Co–Mn–O System
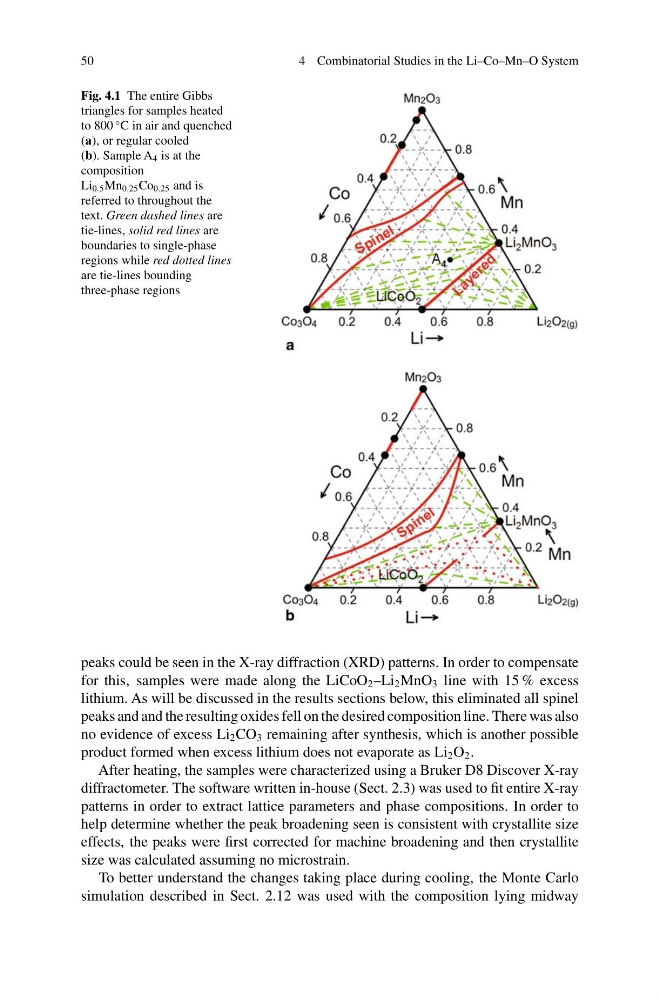
Fig. 4.1 The entire Gibbs
triangles for samples heated
to 800
◦ C in air and quenched
(a), or regular cooled
(b). Sample A 4 is at the
composition
Li 0.5 Mn 0.25 Co 0.25 and is
referred to throughout the
text. Green dashed lines are
tie-lines, solid red lines are
boundaries to single-phase
regions while red dotted lines
are tie-lines bounding
three-phase regions
peaks could be seen in the X-ray diffraction (XRD) patterns. In order to compensate
for this, samples were made along the LiCoO 2 –Li 2 MnO 3 line with 15 % excess
lithium. As will be discussed in the results sections below, this eliminated all spinel
peaks and and the resulting oxides fell on the desired composition line. There was also
no evidence of excess Li 2 CO 3 remaining after synthesis, which is another possible
product formed when excess lithium does not evaporate as Li 2 O 2 .
After heating, the samples were characterized using a Bruker D8 Discover X-ray
diffractometer. The software written in-house (Sect. 2.3) was used to fit entire X-ray
patterns in order to extract lattice parameters and phase compositions. In order to
help determine whether the peak broadening seen is consistent with crystallite size
effects, the peaks were first corrected for machine broadening and then crystallite
size was calculated assuming no microstrain.
To better understand the changes taking place during cooling, the Monte Carlo
simulation described in Sect. 2.12 was used with the composition lying midway
4 Combinatorial Studies in the Li–Co–Mn–O System
Fig. 4.1 The entire Gibbs
triangles for samples heated
to 800
◦ C in air and quenched
(a), or regular cooled
(b). Sample A 4 is at the
composition
Li 0.5 Mn 0.25 Co 0.25 and is
referred to throughout the
text. Green dashed lines are
tie-lines, solid red lines are
boundaries to single-phase
regions while red dotted lines
are tie-lines bounding
three-phase regions
peaks could be seen in the X-ray diffraction (XRD) patterns. In order to compensate
for this, samples were made along the LiCoO 2 –Li 2 MnO 3 line with 15 % excess
lithium. As will be discussed in the results sections below, this eliminated all spinel
peaks and and the resulting oxides fell on the desired composition line. There was also
no evidence of excess Li 2 CO 3 remaining after synthesis, which is another possible
product formed when excess lithium does not evaporate as Li 2 O 2 .
After heating, the samples were characterized using a Bruker D8 Discover X-ray
diffractometer. The software written in-house (Sect. 2.3) was used to fit entire X-ray
patterns in order to extract lattice parameters and phase compositions. In order to
help determine whether the peak broadening seen is consistent with crystallite size
effects, the peaks were first corrected for machine broadening and then crystallite
size was calculated assuming no microstrain.
To better understand the changes taking place during cooling, the Monte Carlo
simulation described in Sect. 2.12 was used with the composition lying midway