

40
3 Optimization of the Synthesis of Combinatorial Samples
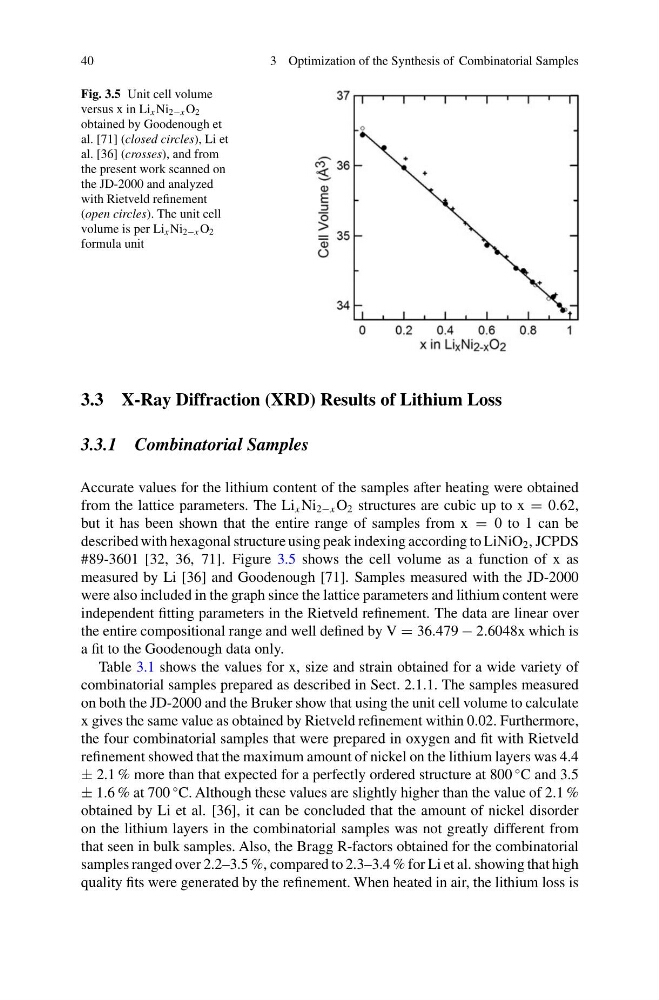
Fig. 3.5 Unit cell volume
versus x in Li x Ni 2−x O 2
obtained by Goodenough et
al. [71] (closed circles), Li et
al. [36] (crosses), and from
the present work scanned on
the JD-2000 and analyzed
with Rietveld refinement
(open circles). The unit cell
volume is per Li x Ni 2−x O 2
formula unit
3.3 X-Ray Diffraction (XRD) Results of Lithium Loss
3.3.1 Combinatorial Samples
Accurate values for the lithium content of the samples after heating were obtained
from the lattice parameters. The Li x Ni 2−x O 2 structures are cubic up to x = 0.62,
but it has been shown that the entire range of samples from x = 0 to 1 can be
described with hexagonal structure using peak indexing according to LiNiO 2 , JCPDS
#89-3601 [32, 36, 71]. Figure 3.5 shows the cell volume as a function of x as
measured by Li [36] and Goodenough [71]. Samples measured with the JD-2000
were also included in the graph since the lattice parameters and lithium content were
independent fitting parameters in the Rietveld refinement. The data are linear over
the entire compositional range and well defined by V = 36.479 − 2.6048x which is
a fit to the Goodenough data only.
Table 3.1 shows the values for x, size and strain obtained for a wide variety of
combinatorial samples prepared as described in Sect. 2.1.1. The samples measured
on both the JD-2000 and the Bruker show that using the unit cell volume to calculate
x gives the same value as obtained by Rietveld refinement within 0.02. Furthermore,
the four combinatorial samples that were prepared in oxygen and fit with Rietveld
refinement showed that the maximum amount of nickel on the lithium layers was 4.4
± 2.1 % more than that expected for a perfectly ordered structure at 800
◦ C and 3.5
± 1.6 % at 700
◦ C. Although these values are slightly higher than the value of 2.1 %
obtained by Li et al. [36], it can be concluded that the amount of nickel disorder
on the lithium layers in the combinatorial samples was not greatly different from
that seen in bulk samples. Also, the Bragg R-factors obtained for the combinatorial
samples ranged over 2.2–3.5 %, compared to 2.3–3.4 % for Li et al. showing that high
quality fits were generated by the refinement. When heated in air, the lithium loss is
3 Optimization of the Synthesis of Combinatorial Samples
Fig. 3.5 Unit cell volume
versus x in Li x Ni 2−x O 2
obtained by Goodenough et
al. [71] (closed circles), Li et
al. [36] (crosses), and from
the present work scanned on
the JD-2000 and analyzed
with Rietveld refinement
(open circles). The unit cell
volume is per Li x Ni 2−x O 2
formula unit
3.3 X-Ray Diffraction (XRD) Results of Lithium Loss
3.3.1 Combinatorial Samples
Accurate values for the lithium content of the samples after heating were obtained
from the lattice parameters. The Li x Ni 2−x O 2 structures are cubic up to x = 0.62,
but it has been shown that the entire range of samples from x = 0 to 1 can be
described with hexagonal structure using peak indexing according to LiNiO 2 , JCPDS
#89-3601 [32, 36, 71]. Figure 3.5 shows the cell volume as a function of x as
measured by Li [36] and Goodenough [71]. Samples measured with the JD-2000
were also included in the graph since the lattice parameters and lithium content were
independent fitting parameters in the Rietveld refinement. The data are linear over
the entire compositional range and well defined by V = 36.479 − 2.6048x which is
a fit to the Goodenough data only.
Table 3.1 shows the values for x, size and strain obtained for a wide variety of
combinatorial samples prepared as described in Sect. 2.1.1. The samples measured
on both the JD-2000 and the Bruker show that using the unit cell volume to calculate
x gives the same value as obtained by Rietveld refinement within 0.02. Furthermore,
the four combinatorial samples that were prepared in oxygen and fit with Rietveld
refinement showed that the maximum amount of nickel on the lithium layers was 4.4
± 2.1 % more than that expected for a perfectly ordered structure at 800
◦ C and 3.5
± 1.6 % at 700
◦ C. Although these values are slightly higher than the value of 2.1 %
obtained by Li et al. [36], it can be concluded that the amount of nickel disorder
on the lithium layers in the combinatorial samples was not greatly different from
that seen in bulk samples. Also, the Bragg R-factors obtained for the combinatorial
samples ranged over 2.2–3.5 %, compared to 2.3–3.4 % for Li et al. showing that high
quality fits were generated by the refinement. When heated in air, the lithium loss is