

2.3 Fitting of Combinatorial X-Ray Diffraction Patterns
27
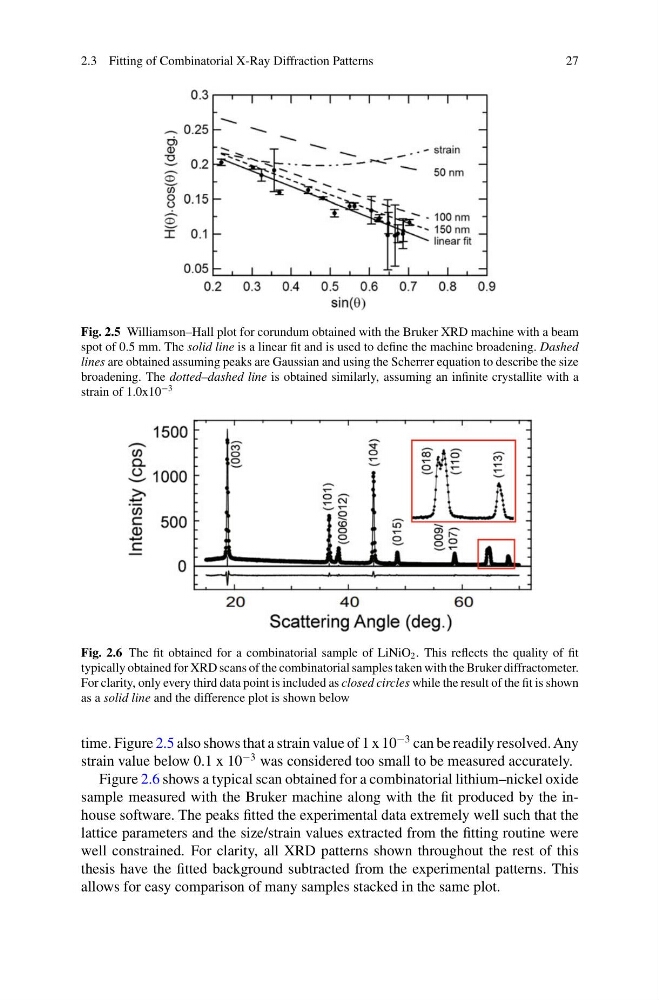
Fig. 2.5 Williamson–Hall plot for corundum obtained with the Bruker XRD machine with a beam
spot of 0.5 mm. The solid line is a linear fit and is used to define the machine broadening. Dashed
lines are obtained assuming peaks are Gaussian and using the Scherrer equation to describe the size
broadening. The dotted–dashed line is obtained similarly, assuming an infinite crystallite with a
strain of 1.0x10
−3
Fig. 2.6 The fit obtained for a combinatorial sample of LiNiO 2 . This reflects the quality of fit
typically obtained for XRD scans of the combinatorial samples taken with the Bruker diffractometer.
For clarity, only every third data point is included as closed circles while the result of the fit is shown
as a solid line and the difference plot is shown below
time. Figure 2.5 also shows that a strain value of 1 x 10
−3 can be readily resolved. Any
strain value below 0.1 x 10
−3 was considered too small to be measured accurately.
Figure 2.6 shows a typical scan obtained for a combinatorial lithium–nickel oxide
sample measured with the Bruker machine along with the fit produced by the inhouse software. The peaks fitted the experimental data extremely well such that the
lattice parameters and the size/strain values extracted from the fitting routine were
well constrained. For clarity, all XRD patterns shown throughout the rest of this
thesis have the fitted background subtracted from the experimental patterns. This
allows for easy comparison of many samples stacked in the same plot.
27
Fig. 2.5 Williamson–Hall plot for corundum obtained with the Bruker XRD machine with a beam
spot of 0.5 mm. The solid line is a linear fit and is used to define the machine broadening. Dashed
lines are obtained assuming peaks are Gaussian and using the Scherrer equation to describe the size
broadening. The dotted–dashed line is obtained similarly, assuming an infinite crystallite with a
strain of 1.0x10
−3
Fig. 2.6 The fit obtained for a combinatorial sample of LiNiO 2 . This reflects the quality of fit
typically obtained for XRD scans of the combinatorial samples taken with the Bruker diffractometer.
For clarity, only every third data point is included as closed circles while the result of the fit is shown
as a solid line and the difference plot is shown below
time. Figure 2.5 also shows that a strain value of 1 x 10
−3 can be readily resolved. Any
strain value below 0.1 x 10
−3 was considered too small to be measured accurately.
Figure 2.6 shows a typical scan obtained for a combinatorial lithium–nickel oxide
sample measured with the Bruker machine along with the fit produced by the inhouse software. The peaks fitted the experimental data extremely well such that the
lattice parameters and the size/strain values extracted from the fitting routine were
well constrained. For clarity, all XRD patterns shown throughout the rest of this
thesis have the fitted background subtracted from the experimental patterns. This
allows for easy comparison of many samples stacked in the same plot.