

28
2 Experimental and Theoretical Considerations
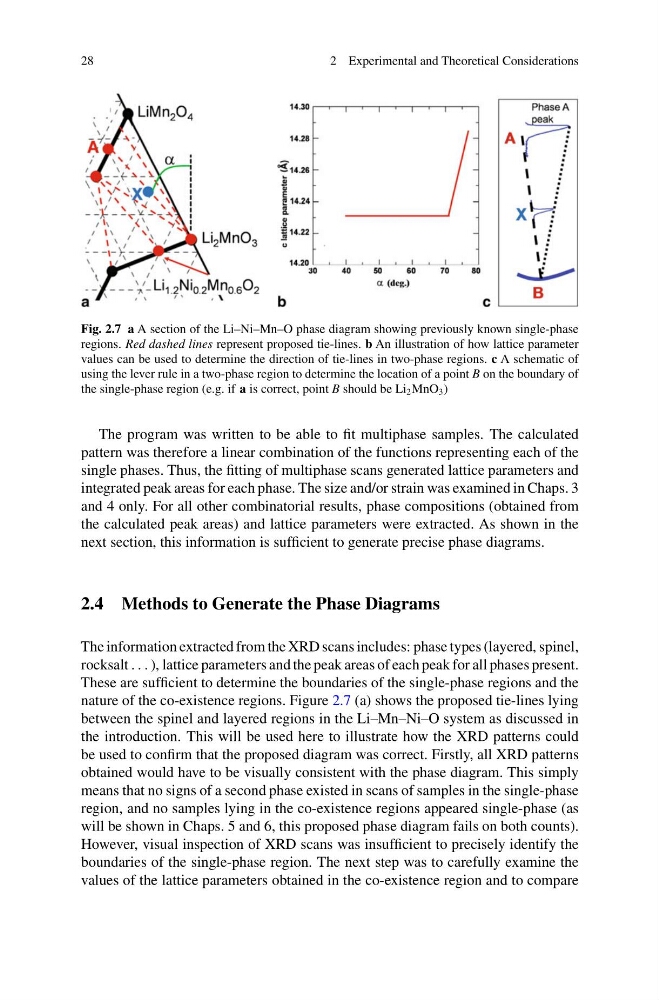
Fig. 2.7 a A section of the Li–Ni–Mn–O phase diagram showing previously known single-phase
regions. Red dashed lines represent proposed tie-lines. b An illustration of how lattice parameter
values can be used to determine the direction of tie-lines in two-phase regions. c A schematic of
using the lever rule in a two-phase region to determine the location of a point B on the boundary of
the single-phase region (e.g. if a is correct, point B should be Li 2 MnO 3 )
The program was written to be able to fit multiphase samples. The calculated
pattern was therefore a linear combination of the functions representing each of the
single phases. Thus, the fitting of multiphase scans generated lattice parameters and
integrated peak areas for each phase. The size and/or strain was examined in Chaps. 3
and 4 only. For all other combinatorial results, phase compositions (obtained from
the calculated peak areas) and lattice parameters were extracted. As shown in the
next section, this information is sufficient to generate precise phase diagrams.
2.4 Methods to Generate the Phase Diagrams
The information extracted from the XRD scans includes: phase types (layered, spinel,
rocksalt . . . ), lattice parameters and the peak areas of each peak for all phases present.
These are sufficient to determine the boundaries of the single-phase regions and the
nature of the co-existence regions. Figure 2.7 (a) shows the proposed tie-lines lying
between the spinel and layered regions in the Li–Mn–Ni–O system as discussed in
the introduction. This will be used here to illustrate how the XRD patterns could
be used to confirm that the proposed diagram was correct. Firstly, all XRD patterns
obtained would have to be visually consistent with the phase diagram. This simply
means that no signs of a second phase existed in scans of samples in the single-phase
region, and no samples lying in the co-existence regions appeared single-phase (as
will be shown in Chaps. 5 and 6, this proposed phase diagram fails on both counts).
However, visual inspection of XRD scans was insufficient to precisely identify the
boundaries of the single-phase region. The next step was to carefully examine the
values of the lattice parameters obtained in the co-existence region and to compare
2 Experimental and Theoretical Considerations
Fig. 2.7 a A section of the Li–Ni–Mn–O phase diagram showing previously known single-phase
regions. Red dashed lines represent proposed tie-lines. b An illustration of how lattice parameter
values can be used to determine the direction of tie-lines in two-phase regions. c A schematic of
using the lever rule in a two-phase region to determine the location of a point B on the boundary of
the single-phase region (e.g. if a is correct, point B should be Li 2 MnO 3 )
The program was written to be able to fit multiphase samples. The calculated
pattern was therefore a linear combination of the functions representing each of the
single phases. Thus, the fitting of multiphase scans generated lattice parameters and
integrated peak areas for each phase. The size and/or strain was examined in Chaps. 3
and 4 only. For all other combinatorial results, phase compositions (obtained from
the calculated peak areas) and lattice parameters were extracted. As shown in the
next section, this information is sufficient to generate precise phase diagrams.
2.4 Methods to Generate the Phase Diagrams
The information extracted from the XRD scans includes: phase types (layered, spinel,
rocksalt . . . ), lattice parameters and the peak areas of each peak for all phases present.
These are sufficient to determine the boundaries of the single-phase regions and the
nature of the co-existence regions. Figure 2.7 (a) shows the proposed tie-lines lying
between the spinel and layered regions in the Li–Mn–Ni–O system as discussed in
the introduction. This will be used here to illustrate how the XRD patterns could
be used to confirm that the proposed diagram was correct. Firstly, all XRD patterns
obtained would have to be visually consistent with the phase diagram. This simply
means that no signs of a second phase existed in scans of samples in the single-phase
region, and no samples lying in the co-existence regions appeared single-phase (as
will be shown in Chaps. 5 and 6, this proposed phase diagram fails on both counts).
However, visual inspection of XRD scans was insufficient to precisely identify the
boundaries of the single-phase region. The next step was to carefully examine the
values of the lattice parameters obtained in the co-existence region and to compare