

1.4 The Li–Mn–Ni–O Face of the Pyramid
9
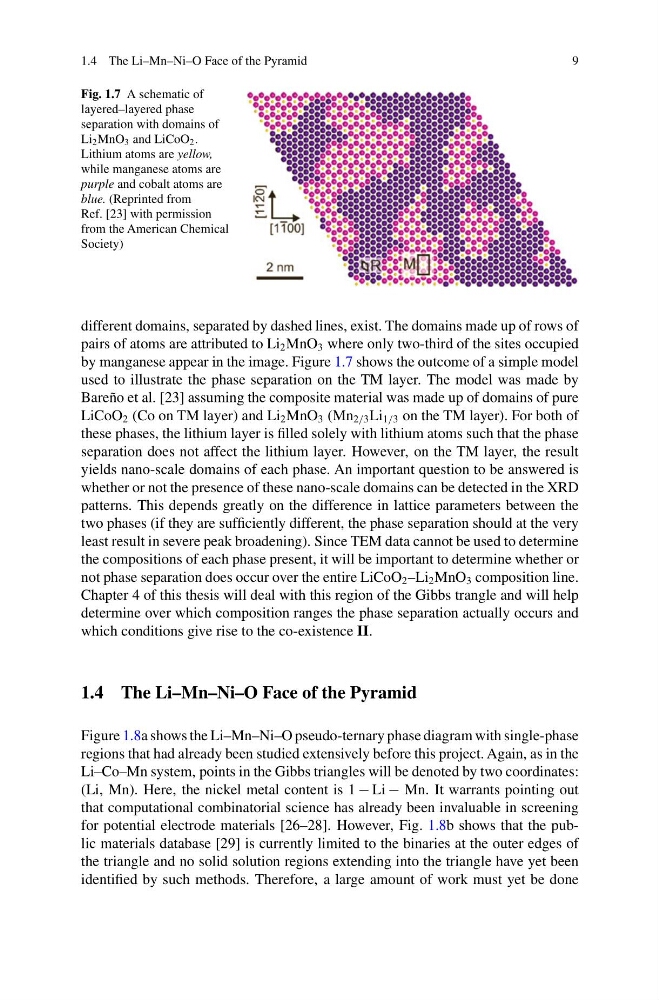
Fig. 1.7 A schematic of
layered–layered phase
separation with domains of
Li 2 MnO 3 and LiCoO 2 .
Lithium atoms are yellow,
while manganese atoms are
purple and cobalt atoms are
blue. (Reprinted from
Ref. [23] with permission
from the American Chemical
Society)
different domains, separated by dashed lines, exist. The domains made up of rows of
pairs of atoms are attributed to Li 2 MnO 3 where only two-third of the sites occupied
by manganese appear in the image. Figure 1.7 shows the outcome of a simple model
used to illustrate the phase separation on the TM layer. The model was made by
Bareño et al. [23] assuming the composite material was made up of domains of pure
LiCoO 2 (Co on TM layer) and Li 2 MnO 3 (Mn 2/3 Li 1/3 on the TM layer). For both of
these phases, the lithium layer is filled solely with lithium atoms such that the phase
separation does not affect the lithium layer. However, on the TM layer, the result
yields nano-scale domains of each phase. An important question to be answered is
whether or not the presence of these nano-scale domains can be detected in the XRD
patterns. This depends greatly on the difference in lattice parameters between the
two phases (if they are sufficiently different, the phase separation should at the very
least result in severe peak broadening). Since TEM data cannot be used to determine
the compositions of each phase present, it will be important to determine whether or
not phase separation does occur over the entire LiCoO 2 –Li 2 MnO 3 composition line.
Chapter 4 of this thesis will deal with this region of the Gibbs trangle and will help
determine over which composition ranges the phase separation actually occurs and
which conditions give rise to the co-existence II.
1.4 The Li–Mn–Ni–O Face of the Pyramid
Figure 1.8a shows the Li–Mn–Ni–O pseudo-ternary phase diagram with single-phase
regions that had already been studied extensively before this project. Again, as in the
Li–Co–Mn system, points in the Gibbs triangles will be denoted by two coordinates:
(Li, Mn). Here, the nickel metal content is 1 − Li − Mn. It warrants pointing out
that computational combinatorial science has already been invaluable in screening
for potential electrode materials [26–28]. However, Fig. 1.8b shows that the public materials database [29] is currently limited to the binaries at the outer edges of
the triangle and no solid solution regions extending into the triangle have yet been
identified by such methods. Therefore, a large amount of work must yet be done
9
Fig. 1.7 A schematic of
layered–layered phase
separation with domains of
Li 2 MnO 3 and LiCoO 2 .
Lithium atoms are yellow,
while manganese atoms are
purple and cobalt atoms are
blue. (Reprinted from
Ref. [23] with permission
from the American Chemical
Society)
different domains, separated by dashed lines, exist. The domains made up of rows of
pairs of atoms are attributed to Li 2 MnO 3 where only two-third of the sites occupied
by manganese appear in the image. Figure 1.7 shows the outcome of a simple model
used to illustrate the phase separation on the TM layer. The model was made by
Bareño et al. [23] assuming the composite material was made up of domains of pure
LiCoO 2 (Co on TM layer) and Li 2 MnO 3 (Mn 2/3 Li 1/3 on the TM layer). For both of
these phases, the lithium layer is filled solely with lithium atoms such that the phase
separation does not affect the lithium layer. However, on the TM layer, the result
yields nano-scale domains of each phase. An important question to be answered is
whether or not the presence of these nano-scale domains can be detected in the XRD
patterns. This depends greatly on the difference in lattice parameters between the
two phases (if they are sufficiently different, the phase separation should at the very
least result in severe peak broadening). Since TEM data cannot be used to determine
the compositions of each phase present, it will be important to determine whether or
not phase separation does occur over the entire LiCoO 2 –Li 2 MnO 3 composition line.
Chapter 4 of this thesis will deal with this region of the Gibbs trangle and will help
determine over which composition ranges the phase separation actually occurs and
which conditions give rise to the co-existence II.
1.4 The Li–Mn–Ni–O Face of the Pyramid
Figure 1.8a shows the Li–Mn–Ni–O pseudo-ternary phase diagram with single-phase
regions that had already been studied extensively before this project. Again, as in the
Li–Co–Mn system, points in the Gibbs triangles will be denoted by two coordinates:
(Li, Mn). Here, the nickel metal content is 1 − Li − Mn. It warrants pointing out
that computational combinatorial science has already been invaluable in screening
for potential electrode materials [26–28]. However, Fig. 1.8b shows that the public materials database [29] is currently limited to the binaries at the outer edges of
the triangle and no solid solution regions extending into the triangle have yet been
identified by such methods. Therefore, a large amount of work must yet be done