

10
1 Introduction
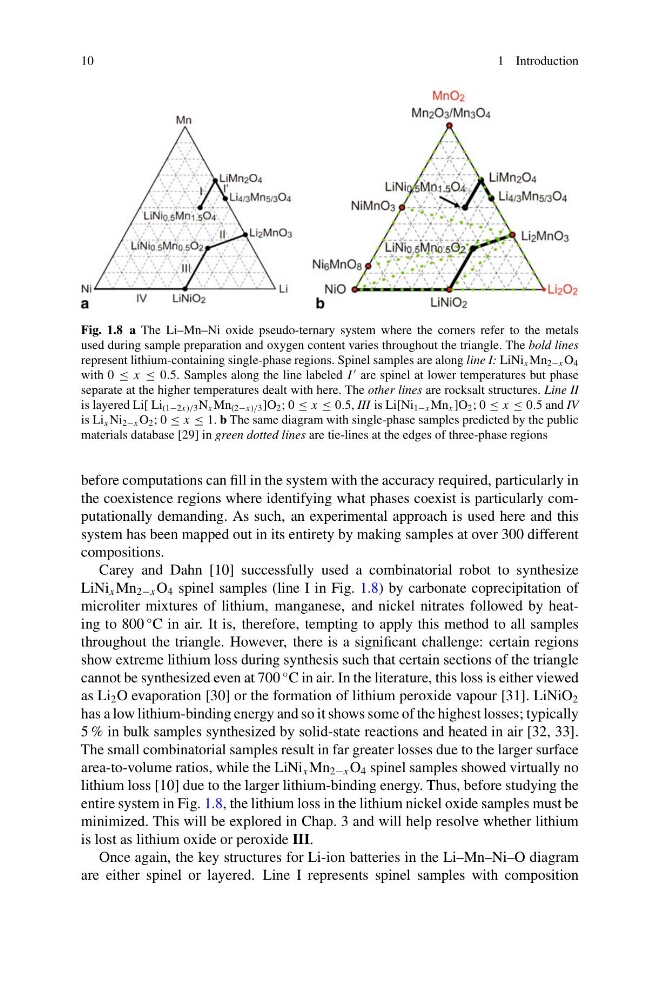
Fig. 1.8 a The Li–Mn–Ni oxide pseudo-ternary system where the corners refer to the metals
used during sample preparation and oxygen content varies throughout the triangle. The bold lines
represent lithium-containing single-phase regions. Spinel samples are along line I: LiNi x Mn 2−x O 4
with 0 ≤ x ≤ 0.5. Samples along the line labeled I
are spinel at lower temperatures but phase
separate at the higher temperatures dealt with here. The other lines are rocksalt structures. Line II
is layered Li[ Li (1−2x)/3 N x Mn (2−x)/3 ]O 2 ; 0 ≤ x ≤ 0.5, III is Li[Ni 1−x Mn x ]O 2 ; 0 ≤ x ≤ 0.5 and IV
is Li x Ni 2−x O 2 ; 0 ≤ x ≤ 1. b The same diagram with single-phase samples predicted by the public
materials database [29] in green dotted lines are tie-lines at the edges of three-phase regions
before computations can fill in the system with the accuracy required, particularly in
the coexistence regions where identifying what phases coexist is particularly computationally demanding. As such, an experimental approach is used here and this
system has been mapped out in its entirety by making samples at over 300 different
compositions.
Carey and Dahn [10] successfully used a combinatorial robot to synthesize
LiNi x Mn 2−x O 4 spinel samples (line I in Fig. 1.8) by carbonate coprecipitation of
microliter mixtures of lithium, manganese, and nickel nitrates followed by heating to 800
◦ C in air. It is, therefore, tempting to apply this method to all samples
throughout the triangle. However, there is a significant challenge: certain regions
show extreme lithium loss during synthesis such that certain sections of the triangle
cannot be synthesized even at 700
◦ C in air. In the literature, this loss is either viewed
as Li 2 O evaporation [30] or the formation of lithium peroxide vapour [31]. LiNiO 2
has a low lithium-binding energy and so it shows some of the highest losses; typically
5 % in bulk samples synthesized by solid-state reactions and heated in air [32, 33].
The small combinatorial samples result in far greater losses due to the larger surface
area-to-volume ratios, while the LiNi x Mn 2−x O 4 spinel samples showed virtually no
lithium loss [10] due to the larger lithium-binding energy. Thus, before studying the
entire system in Fig. 1.8, the lithium loss in the lithium nickel oxide samples must be
minimized. This will be explored in Chap. 3 and will help resolve whether lithium
is lost as lithium oxide or peroxide III.
Once again, the key structures for Li-ion batteries in the Li–Mn–Ni–O diagram
are either spinel or layered. Line I represents spinel samples with composition
1 Introduction
Fig. 1.8 a The Li–Mn–Ni oxide pseudo-ternary system where the corners refer to the metals
used during sample preparation and oxygen content varies throughout the triangle. The bold lines
represent lithium-containing single-phase regions. Spinel samples are along line I: LiNi x Mn 2−x O 4
with 0 ≤ x ≤ 0.5. Samples along the line labeled I
are spinel at lower temperatures but phase
separate at the higher temperatures dealt with here. The other lines are rocksalt structures. Line II
is layered Li[ Li (1−2x)/3 N x Mn (2−x)/3 ]O 2 ; 0 ≤ x ≤ 0.5, III is Li[Ni 1−x Mn x ]O 2 ; 0 ≤ x ≤ 0.5 and IV
is Li x Ni 2−x O 2 ; 0 ≤ x ≤ 1. b The same diagram with single-phase samples predicted by the public
materials database [29] in green dotted lines are tie-lines at the edges of three-phase regions
before computations can fill in the system with the accuracy required, particularly in
the coexistence regions where identifying what phases coexist is particularly computationally demanding. As such, an experimental approach is used here and this
system has been mapped out in its entirety by making samples at over 300 different
compositions.
Carey and Dahn [10] successfully used a combinatorial robot to synthesize
LiNi x Mn 2−x O 4 spinel samples (line I in Fig. 1.8) by carbonate coprecipitation of
microliter mixtures of lithium, manganese, and nickel nitrates followed by heating to 800
◦ C in air. It is, therefore, tempting to apply this method to all samples
throughout the triangle. However, there is a significant challenge: certain regions
show extreme lithium loss during synthesis such that certain sections of the triangle
cannot be synthesized even at 700
◦ C in air. In the literature, this loss is either viewed
as Li 2 O evaporation [30] or the formation of lithium peroxide vapour [31]. LiNiO 2
has a low lithium-binding energy and so it shows some of the highest losses; typically
5 % in bulk samples synthesized by solid-state reactions and heated in air [32, 33].
The small combinatorial samples result in far greater losses due to the larger surface
area-to-volume ratios, while the LiNi x Mn 2−x O 4 spinel samples showed virtually no
lithium loss [10] due to the larger lithium-binding energy. Thus, before studying the
entire system in Fig. 1.8, the lithium loss in the lithium nickel oxide samples must be
minimized. This will be explored in Chap. 3 and will help resolve whether lithium
is lost as lithium oxide or peroxide III.
Once again, the key structures for Li-ion batteries in the Li–Mn–Ni–O diagram
are either spinel or layered. Line I represents spinel samples with composition