

8
1 Introduction
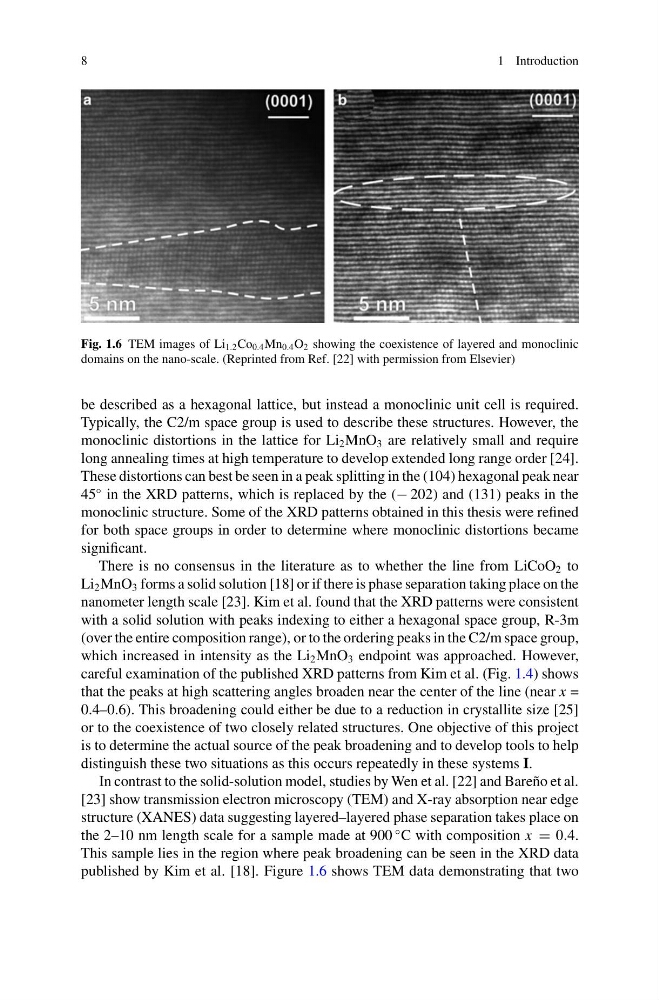
Fig. 1.6 TEM images of Li 1.2 Co 0.4 Mn 0.4 O 2 showing the coexistence of layered and monoclinic
domains on the nano-scale. (Reprinted from Ref. [22] with permission from Elsevier)
be described as a hexagonal lattice, but instead a monoclinic unit cell is required.
Typically, the C2/m space group is used to describe these structures. However, the
monoclinic distortions in the lattice for Li 2 MnO 3 are relatively small and require
long annealing times at high temperature to develop extended long range order [24].
These distortions can best be seen in a peak splitting in the (104) hexagonal peak near
45
◦ in the XRD patterns, which is replaced by the (− 202) and (131) peaks in the
monoclinic structure. Some of the XRD patterns obtained in this thesis were refined
for both space groups in order to determine where monoclinic distortions became
significant.
There is no consensus in the literature as to whether the line from LiCoO 2 to
Li 2 MnO 3 forms a solid solution [18] or if there is phase separation taking place on the
nanometer length scale [23]. Kim et al. found that the XRD patterns were consistent
with a solid solution with peaks indexing to either a hexagonal space group, R-3m
(over the entire composition range), or to the ordering peaks in the C2/m space group,
which increased in intensity as the Li 2 MnO 3 endpoint was approached. However,
careful examination of the published XRD patterns from Kim et al. (Fig. 1.4) shows
that the peaks at high scattering angles broaden near the center of the line (near x =
0.4–0.6). This broadening could either be due to a reduction in crystallite size [25]
or to the coexistence of two closely related structures. One objective of this project
is to determine the actual source of the peak broadening and to develop tools to help
distinguish these two situations as this occurs repeatedly in these systems I.
In contrast to the solid-solution model, studies by Wen et al. [22] and Bareño et al.
[23] show transmission electron microscopy (TEM) and X-ray absorption near edge
structure (XANES) data suggesting layered–layered phase separation takes place on
the 2–10 nm length scale for a sample made at 900
◦ C with composition x = 0.4.
This sample lies in the region where peak broadening can be seen in the XRD data
published by Kim et al. [18]. Figure 1.6 shows TEM data demonstrating that two
1 Introduction
Fig. 1.6 TEM images of Li 1.2 Co 0.4 Mn 0.4 O 2 showing the coexistence of layered and monoclinic
domains on the nano-scale. (Reprinted from Ref. [22] with permission from Elsevier)
be described as a hexagonal lattice, but instead a monoclinic unit cell is required.
Typically, the C2/m space group is used to describe these structures. However, the
monoclinic distortions in the lattice for Li 2 MnO 3 are relatively small and require
long annealing times at high temperature to develop extended long range order [24].
These distortions can best be seen in a peak splitting in the (104) hexagonal peak near
45
◦ in the XRD patterns, which is replaced by the (− 202) and (131) peaks in the
monoclinic structure. Some of the XRD patterns obtained in this thesis were refined
for both space groups in order to determine where monoclinic distortions became
significant.
There is no consensus in the literature as to whether the line from LiCoO 2 to
Li 2 MnO 3 forms a solid solution [18] or if there is phase separation taking place on the
nanometer length scale [23]. Kim et al. found that the XRD patterns were consistent
with a solid solution with peaks indexing to either a hexagonal space group, R-3m
(over the entire composition range), or to the ordering peaks in the C2/m space group,
which increased in intensity as the Li 2 MnO 3 endpoint was approached. However,
careful examination of the published XRD patterns from Kim et al. (Fig. 1.4) shows
that the peaks at high scattering angles broaden near the center of the line (near x =
0.4–0.6). This broadening could either be due to a reduction in crystallite size [25]
or to the coexistence of two closely related structures. One objective of this project
is to determine the actual source of the peak broadening and to develop tools to help
distinguish these two situations as this occurs repeatedly in these systems I.
In contrast to the solid-solution model, studies by Wen et al. [22] and Bareño et al.
[23] show transmission electron microscopy (TEM) and X-ray absorption near edge
structure (XANES) data suggesting layered–layered phase separation takes place on
the 2–10 nm length scale for a sample made at 900
◦ C with composition x = 0.4.
This sample lies in the region where peak broadening can be seen in the XRD data
published by Kim et al. [18]. Figure 1.6 shows TEM data demonstrating that two