

1.3 The Li–Co–Mn–O Face of the Pyramid
7
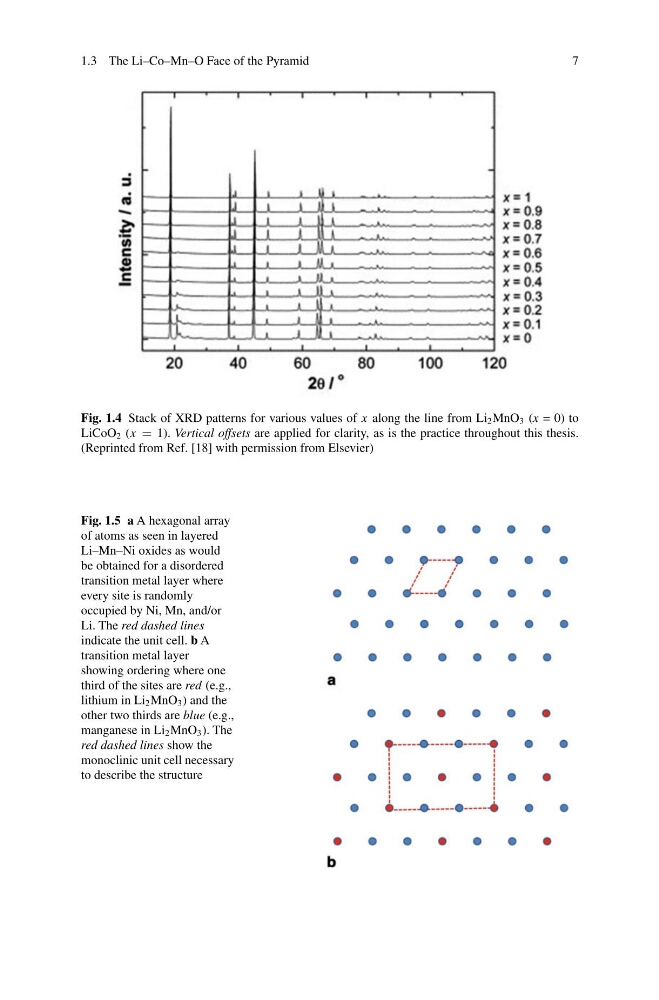
Fig. 1.4 Stack of XRD patterns for various values of x along the line from Li 2 MnO 3 (x = 0) to
LiCoO 2 (x = 1). Vertical offsets are applied for clarity, as is the practice throughout this thesis.
(Reprinted from Ref. [18] with permission from Elsevier)
Fig. 1.5 a A hexagonal array
of atoms as seen in layered
Li–Mn–Ni oxides as would
be obtained for a disordered
transition metal layer where
every site is randomly
occupied by Ni, Mn, and/or
Li. The red dashed lines
indicate the unit cell. b A
transition metal layer
showing ordering where one
third of the sites are red (e.g.,
lithium in Li 2 MnO 3 ) and the
other two thirds are blue (e.g.,
manganese in Li 2 MnO 3 ). The
red dashed lines show the
monoclinic unit cell necessary
to describe the structure
7
Fig. 1.4 Stack of XRD patterns for various values of x along the line from Li 2 MnO 3 (x = 0) to
LiCoO 2 (x = 1). Vertical offsets are applied for clarity, as is the practice throughout this thesis.
(Reprinted from Ref. [18] with permission from Elsevier)
Fig. 1.5 a A hexagonal array
of atoms as seen in layered
Li–Mn–Ni oxides as would
be obtained for a disordered
transition metal layer where
every site is randomly
occupied by Ni, Mn, and/or
Li. The red dashed lines
indicate the unit cell. b A
transition metal layer
showing ordering where one
third of the sites are red (e.g.,
lithium in Li 2 MnO 3 ) and the
other two thirds are blue (e.g.,
manganese in Li 2 MnO 3 ). The
red dashed lines show the
monoclinic unit cell necessary
to describe the structure