

124
9 Materials Near the Layered Boundary
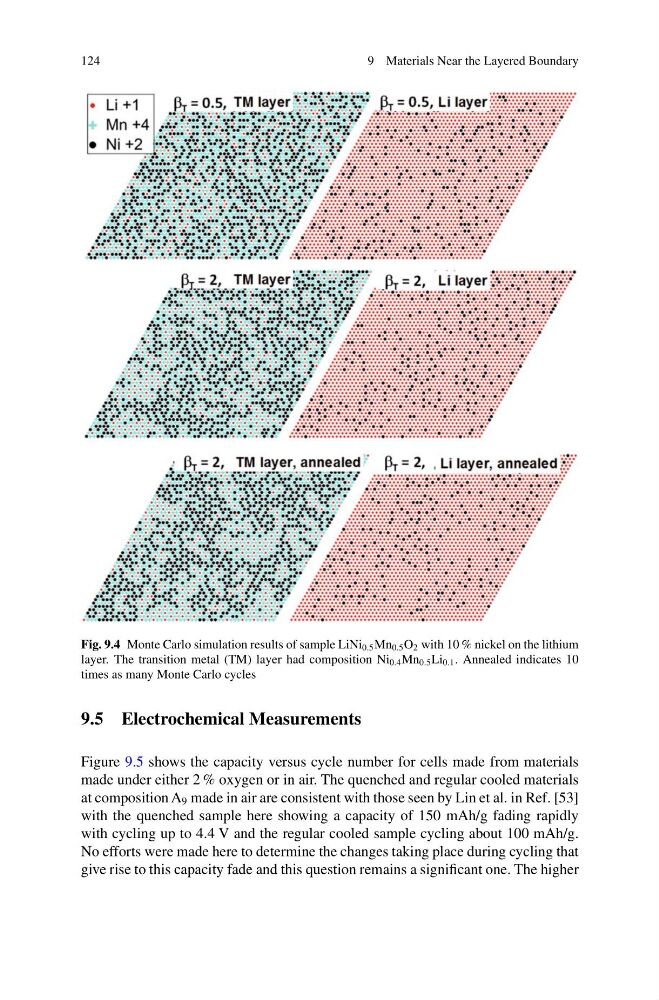
Fig. 9.4 Monte Carlo simulation results of sample LiNi 0.5 Mn 0.5 O 2 with 10 % nickel on the lithium
layer. The transition metal (TM) layer had composition Ni 0.4 Mn 0.5 Li 0.1 . Annealed indicates 10
times as many Monte Carlo cycles
9.5 Electrochemical Measurements
Figure 9.5 shows the capacity versus cycle number for cells made from materials
made under either 2 % oxygen or in air. The quenched and regular cooled materials
at composition A 9 made in air are consistent with those seen by Lin et al. in Ref. [53]
with the quenched sample here showing a capacity of 150 mAh/g fading rapidly
with cycling up to 4.4 V and the regular cooled sample cycling about 100 mAh/g.
No efforts were made here to determine the changes taking place during cycling that
give rise to this capacity fade and this question remains a significant one. The higher
9 Materials Near the Layered Boundary
Fig. 9.4 Monte Carlo simulation results of sample LiNi 0.5 Mn 0.5 O 2 with 10 % nickel on the lithium
layer. The transition metal (TM) layer had composition Ni 0.4 Mn 0.5 Li 0.1 . Annealed indicates 10
times as many Monte Carlo cycles
9.5 Electrochemical Measurements
Figure 9.5 shows the capacity versus cycle number for cells made from materials
made under either 2 % oxygen or in air. The quenched and regular cooled materials
at composition A 9 made in air are consistent with those seen by Lin et al. in Ref. [53]
with the quenched sample here showing a capacity of 150 mAh/g fading rapidly
with cycling up to 4.4 V and the regular cooled sample cycling about 100 mAh/g.
No efforts were made here to determine the changes taking place during cycling that
give rise to this capacity fade and this question remains a significant one. The higher