

122
9 Materials Near the Layered Boundary
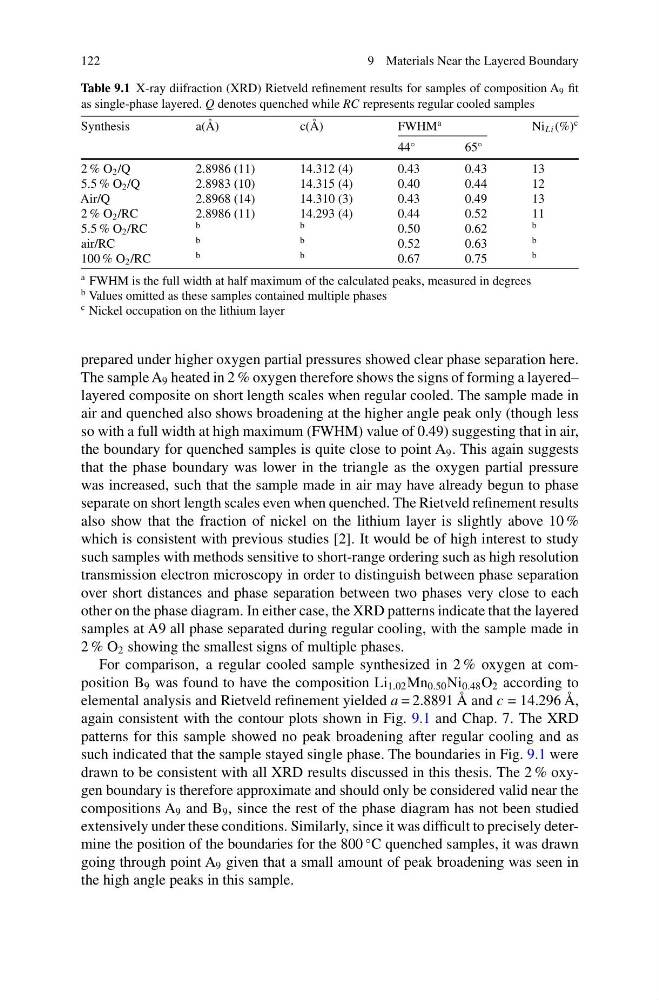
Table 9.1 X-ray diifraction (XRD) Rietveld refinement results for samples of composition A 9 fit
as single-phase layered. Q denotes quenched while RC represents regular cooled samples
Synthesis
a(Å)
c(Å)
FWHM
a
Ni Li (%)
c
44
◦
65
◦
2 % O 2 /Q
2.8986 (11)
14.312 (4)
0.43
0.43
13
5.5 % O 2 /Q
2.8983 (10)
14.315 (4)
0.40
0.44
12
Air/Q
2.8968 (14)
14.310 (3)
0.43
0.49
13
2 % O 2 /RC
2.8986 (11)
14.293 (4)
0.44
0.52
11
5.5 % O 2 /RC
b
b
0.50
0.62
b
air/RC
b
b
0.52
0.63
b
100 % O 2 /RC
b
b
0.67
0.75
b
a FWHM is the full width at half maximum of the calculated peaks, measured in degrees
b Values omitted as these samples contained multiple phases
c Nickel occupation on the lithium layer
prepared under higher oxygen partial pressures showed clear phase separation here.
The sample A 9 heated in 2 % oxygen therefore shows the signs of forming a layered–
layered composite on short length scales when regular cooled. The sample made in
air and quenched also shows broadening at the higher angle peak only (though less
so with a full width at high maximum (FWHM) value of 0.49) suggesting that in air,
the boundary for quenched samples is quite close to point A 9 . This again suggests
that the phase boundary was lower in the triangle as the oxygen partial pressure
was increased, such that the sample made in air may have already begun to phase
separate on short length scales even when quenched. The Rietveld refinement results
also show that the fraction of nickel on the lithium layer is slightly above 10 %
which is consistent with previous studies [2]. It would be of high interest to study
such samples with methods sensitive to short-range ordering such as high resolution
transmission electron microscopy in order to distinguish between phase separation
over short distances and phase separation between two phases very close to each
other on the phase diagram. In either case, the XRD patterns indicate that the layered
samples at A9 all phase separated during regular cooling, with the sample made in
2 % O 2 showing the smallest signs of multiple phases.
For comparison, a regular cooled sample synthesized in 2 % oxygen at composition B 9 was found to have the composition Li 1.02 Mn 0.50 Ni 0.48 O 2 according to
elemental analysis and Rietveld refinement yielded a = 2.8891 Å and c = 14.296 Å,
again consistent with the contour plots shown in Fig. 9.1 and Chap. 7. The XRD
patterns for this sample showed no peak broadening after regular cooling and as
such indicated that the sample stayed single phase. The boundaries in Fig. 9.1 were
drawn to be consistent with all XRD results discussed in this thesis. The 2 % oxygen boundary is therefore approximate and should only be considered valid near the
compositions A 9 and B 9 , since the rest of the phase diagram has not been studied
extensively under these conditions. Similarly, since it was difficult to precisely determine the position of the boundaries for the 800
◦ C quenched samples, it was drawn
going through point A 9 given that a small amount of peak broadening was seen in
the high angle peaks in this sample.
9 Materials Near the Layered Boundary
Table 9.1 X-ray diifraction (XRD) Rietveld refinement results for samples of composition A 9 fit
as single-phase layered. Q denotes quenched while RC represents regular cooled samples
Synthesis
a(Å)
c(Å)
FWHM
a
Ni Li (%)
c
44
◦
65
◦
2 % O 2 /Q
2.8986 (11)
14.312 (4)
0.43
0.43
13
5.5 % O 2 /Q
2.8983 (10)
14.315 (4)
0.40
0.44
12
Air/Q
2.8968 (14)
14.310 (3)
0.43
0.49
13
2 % O 2 /RC
2.8986 (11)
14.293 (4)
0.44
0.52
11
5.5 % O 2 /RC
b
b
0.50
0.62
b
air/RC
b
b
0.52
0.63
b
100 % O 2 /RC
b
b
0.67
0.75
b
a FWHM is the full width at half maximum of the calculated peaks, measured in degrees
b Values omitted as these samples contained multiple phases
c Nickel occupation on the lithium layer
prepared under higher oxygen partial pressures showed clear phase separation here.
The sample A 9 heated in 2 % oxygen therefore shows the signs of forming a layered–
layered composite on short length scales when regular cooled. The sample made in
air and quenched also shows broadening at the higher angle peak only (though less
so with a full width at high maximum (FWHM) value of 0.49) suggesting that in air,
the boundary for quenched samples is quite close to point A 9 . This again suggests
that the phase boundary was lower in the triangle as the oxygen partial pressure
was increased, such that the sample made in air may have already begun to phase
separate on short length scales even when quenched. The Rietveld refinement results
also show that the fraction of nickel on the lithium layer is slightly above 10 %
which is consistent with previous studies [2]. It would be of high interest to study
such samples with methods sensitive to short-range ordering such as high resolution
transmission electron microscopy in order to distinguish between phase separation
over short distances and phase separation between two phases very close to each
other on the phase diagram. In either case, the XRD patterns indicate that the layered
samples at A9 all phase separated during regular cooling, with the sample made in
2 % O 2 showing the smallest signs of multiple phases.
For comparison, a regular cooled sample synthesized in 2 % oxygen at composition B 9 was found to have the composition Li 1.02 Mn 0.50 Ni 0.48 O 2 according to
elemental analysis and Rietveld refinement yielded a = 2.8891 Å and c = 14.296 Å,
again consistent with the contour plots shown in Fig. 9.1 and Chap. 7. The XRD
patterns for this sample showed no peak broadening after regular cooling and as
such indicated that the sample stayed single phase. The boundaries in Fig. 9.1 were
drawn to be consistent with all XRD results discussed in this thesis. The 2 % oxygen boundary is therefore approximate and should only be considered valid near the
compositions A 9 and B 9 , since the rest of the phase diagram has not been studied
extensively under these conditions. Similarly, since it was difficult to precisely determine the position of the boundaries for the 800
◦ C quenched samples, it was drawn
going through point A 9 given that a small amount of peak broadening was seen in
the high angle peaks in this sample.