

9.3 Structural Results
121
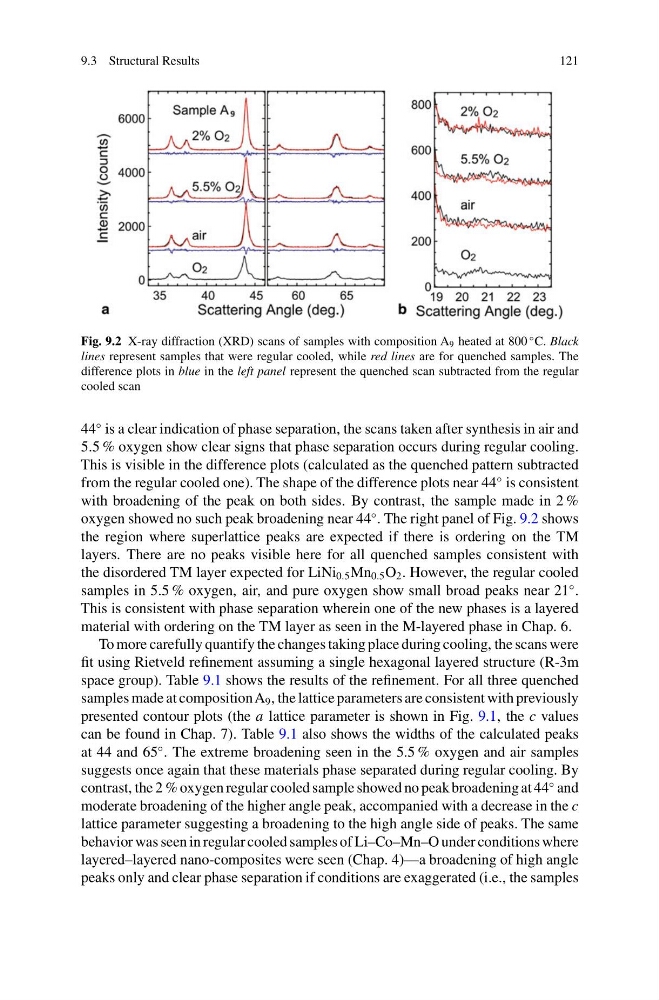
Fig. 9.2 X-ray diffraction (XRD) scans of samples with composition A 9 heated at 800
◦ C. Black
lines represent samples that were regular cooled, while red lines are for quenched samples. The
difference plots in blue in the left panel represent the quenched scan subtracted from the regular
cooled scan
44
◦ is a clear indication of phase separation, the scans taken after synthesis in air and
5.5 % oxygen show clear signs that phase separation occurs during regular cooling.
This is visible in the difference plots (calculated as the quenched pattern subtracted
from the regular cooled one). The shape of the difference plots near 44
◦ is consistent
with broadening of the peak on both sides. By contrast, the sample made in 2 %
oxygen showed no such peak broadening near 44
◦ . The right panel of Fig. 9.2 shows
the region where superlattice peaks are expected if there is ordering on the TM
layers. There are no peaks visible here for all quenched samples consistent with
the disordered TM layer expected for LiNi 0.5 Mn 0.5 O 2 . However, the regular cooled
samples in 5.5 % oxygen, air, and pure oxygen show small broad peaks near 21
◦ .
This is consistent with phase separation wherein one of the new phases is a layered
material with ordering on the TM layer as seen in the M-layered phase in Chap. 6.
To more carefully quantify the changes taking place during cooling, the scans were
fit using Rietveld refinement assuming a single hexagonal layered structure (R-3m
space group). Table 9.1 shows the results of the refinement. For all three quenched
samples made at compositionA 9 , the lattice parameters are consistent with previously
presented contour plots (the a lattice parameter is shown in Fig. 9.1, the c values
can be found in Chap. 7). Table 9.1 also shows the widths of the calculated peaks
at 44 and 65
◦ . The extreme broadening seen in the 5.5 % oxygen and air samples
suggests once again that these materials phase separated during regular cooling. By
contrast, the 2 % oxygen regular cooled sample showed no peak broadening at 44
◦ and
moderate broadening of the higher angle peak, accompanied with a decrease in the c
lattice parameter suggesting a broadening to the high angle side of peaks. The same
behavior was seen in regular cooled samples of Li–Co–Mn–O under conditions where
layered–layered nano-composites were seen (Chap. 4)—a broadening of high angle
peaks only and clear phase separation if conditions are exaggerated (i.e., the samples
121
Fig. 9.2 X-ray diffraction (XRD) scans of samples with composition A 9 heated at 800
◦ C. Black
lines represent samples that were regular cooled, while red lines are for quenched samples. The
difference plots in blue in the left panel represent the quenched scan subtracted from the regular
cooled scan
44
◦ is a clear indication of phase separation, the scans taken after synthesis in air and
5.5 % oxygen show clear signs that phase separation occurs during regular cooling.
This is visible in the difference plots (calculated as the quenched pattern subtracted
from the regular cooled one). The shape of the difference plots near 44
◦ is consistent
with broadening of the peak on both sides. By contrast, the sample made in 2 %
oxygen showed no such peak broadening near 44
◦ . The right panel of Fig. 9.2 shows
the region where superlattice peaks are expected if there is ordering on the TM
layers. There are no peaks visible here for all quenched samples consistent with
the disordered TM layer expected for LiNi 0.5 Mn 0.5 O 2 . However, the regular cooled
samples in 5.5 % oxygen, air, and pure oxygen show small broad peaks near 21
◦ .
This is consistent with phase separation wherein one of the new phases is a layered
material with ordering on the TM layer as seen in the M-layered phase in Chap. 6.
To more carefully quantify the changes taking place during cooling, the scans were
fit using Rietveld refinement assuming a single hexagonal layered structure (R-3m
space group). Table 9.1 shows the results of the refinement. For all three quenched
samples made at compositionA 9 , the lattice parameters are consistent with previously
presented contour plots (the a lattice parameter is shown in Fig. 9.1, the c values
can be found in Chap. 7). Table 9.1 also shows the widths of the calculated peaks
at 44 and 65
◦ . The extreme broadening seen in the 5.5 % oxygen and air samples
suggests once again that these materials phase separated during regular cooling. By
contrast, the 2 % oxygen regular cooled sample showed no peak broadening at 44
◦ and
moderate broadening of the higher angle peak, accompanied with a decrease in the c
lattice parameter suggesting a broadening to the high angle side of peaks. The same
behavior was seen in regular cooled samples of Li–Co–Mn–O under conditions where
layered–layered nano-composites were seen (Chap. 4)—a broadening of high angle
peaks only and clear phase separation if conditions are exaggerated (i.e., the samples