

8.5 Li[Ni 1/6 P 1/6 Mn 2/3 ]O 2
113
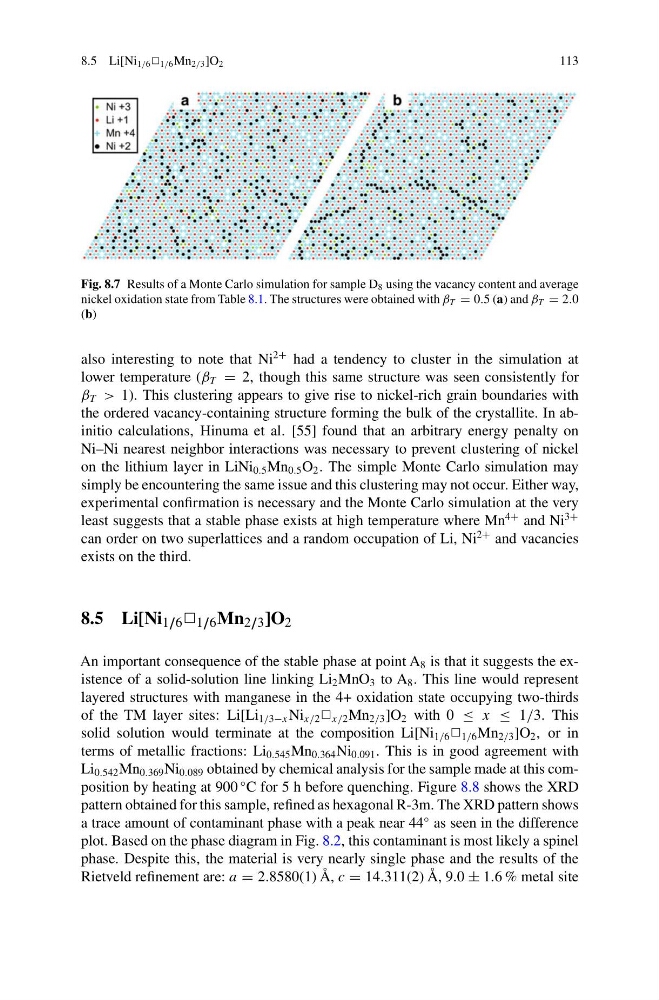
Fig. 8.7 Results of a Monte Carlo simulation for sample D 8 using the vacancy content and average
nickel oxidation state from Table 8.1. The structures were obtained with β T = 0.5 (a) and β T = 2.0
(b)
also interesting to note that Ni
2+ had a tendency to cluster in the simulation at
lower temperature (β T = 2, though this same structure was seen consistently for
β T > 1). This clustering appears to give rise to nickel-rich grain boundaries with
the ordered vacancy-containing structure forming the bulk of the crystallite. In abinitio calculations, Hinuma et al. [55] found that an arbitrary energy penalty on
Ni–Ni nearest neighbor interactions was necessary to prevent clustering of nickel
on the lithium layer in LiNi 0.5 Mn 0.5 O 2 . The simple Monte Carlo simulation may
simply be encountering the same issue and this clustering may not occur. Either way,
experimental confirmation is necessary and the Monte Carlo simulation at the very
least suggests that a stable phase exists at high temperature where Mn
4+ and Ni
3+
can order on two superlattices and a random occupation of Li, Ni
2+ and vacancies
exists on the third.
8.5 Li[Ni 1/6 P 1/6 Mn 2/3 ]O 2
An important consequence of the stable phase at point A 8 is that it suggests the existence of a solid-solution line linking Li 2 MnO 3 to A 8 . This line would represent
layered structures with manganese in the 4+ oxidation state occupying two-thirds
of the TM layer sites: Li[Li 1/3−x Ni x/2 P x/2 Mn 2/3 ]O 2 with 0 ≤ x ≤ 1/3. This
solid solution would terminate at the composition Li[Ni 1/6 P 1/6 Mn 2/3 ]O 2 , or in
terms of metallic fractions: Li 0.545 Mn 0.364 Ni 0.091 . This is in good agreement with
Li 0.542 Mn 0.369 Ni 0.089 obtained by chemical analysis for the sample made at this composition by heating at 900
◦ C for 5 h before quenching. Figure 8.8 shows the XRD
pattern obtained for this sample, refined as hexagonal R-3m. The XRD pattern shows
a trace amount of contaminant phase with a peak near 44
◦ as seen in the difference
plot. Based on the phase diagram in Fig. 8.2, this contaminant is most likely a spinel
phase. Despite this, the material is very nearly single phase and the results of the
Rietveld refinement are: a = 2.8580(1) Å, c = 14.311(2) Å, 9.0 ± 1.6 % metal site
113
Fig. 8.7 Results of a Monte Carlo simulation for sample D 8 using the vacancy content and average
nickel oxidation state from Table 8.1. The structures were obtained with β T = 0.5 (a) and β T = 2.0
(b)
also interesting to note that Ni
2+ had a tendency to cluster in the simulation at
lower temperature (β T = 2, though this same structure was seen consistently for
β T > 1). This clustering appears to give rise to nickel-rich grain boundaries with
the ordered vacancy-containing structure forming the bulk of the crystallite. In abinitio calculations, Hinuma et al. [55] found that an arbitrary energy penalty on
Ni–Ni nearest neighbor interactions was necessary to prevent clustering of nickel
on the lithium layer in LiNi 0.5 Mn 0.5 O 2 . The simple Monte Carlo simulation may
simply be encountering the same issue and this clustering may not occur. Either way,
experimental confirmation is necessary and the Monte Carlo simulation at the very
least suggests that a stable phase exists at high temperature where Mn
4+ and Ni
3+
can order on two superlattices and a random occupation of Li, Ni
2+ and vacancies
exists on the third.
8.5 Li[Ni 1/6 P 1/6 Mn 2/3 ]O 2
An important consequence of the stable phase at point A 8 is that it suggests the existence of a solid-solution line linking Li 2 MnO 3 to A 8 . This line would represent
layered structures with manganese in the 4+ oxidation state occupying two-thirds
of the TM layer sites: Li[Li 1/3−x Ni x/2 P x/2 Mn 2/3 ]O 2 with 0 ≤ x ≤ 1/3. This
solid solution would terminate at the composition Li[Ni 1/6 P 1/6 Mn 2/3 ]O 2 , or in
terms of metallic fractions: Li 0.545 Mn 0.364 Ni 0.091 . This is in good agreement with
Li 0.542 Mn 0.369 Ni 0.089 obtained by chemical analysis for the sample made at this composition by heating at 900
◦ C for 5 h before quenching. Figure 8.8 shows the XRD
pattern obtained for this sample, refined as hexagonal R-3m. The XRD pattern shows
a trace amount of contaminant phase with a peak near 44
◦ as seen in the difference
plot. Based on the phase diagram in Fig. 8.2, this contaminant is most likely a spinel
phase. Despite this, the material is very nearly single phase and the results of the
Rietveld refinement are: a = 2.8580(1) Å, c = 14.311(2) Å, 9.0 ± 1.6 % metal site