

112
8 Layered Materials with Metal Site Vacancies
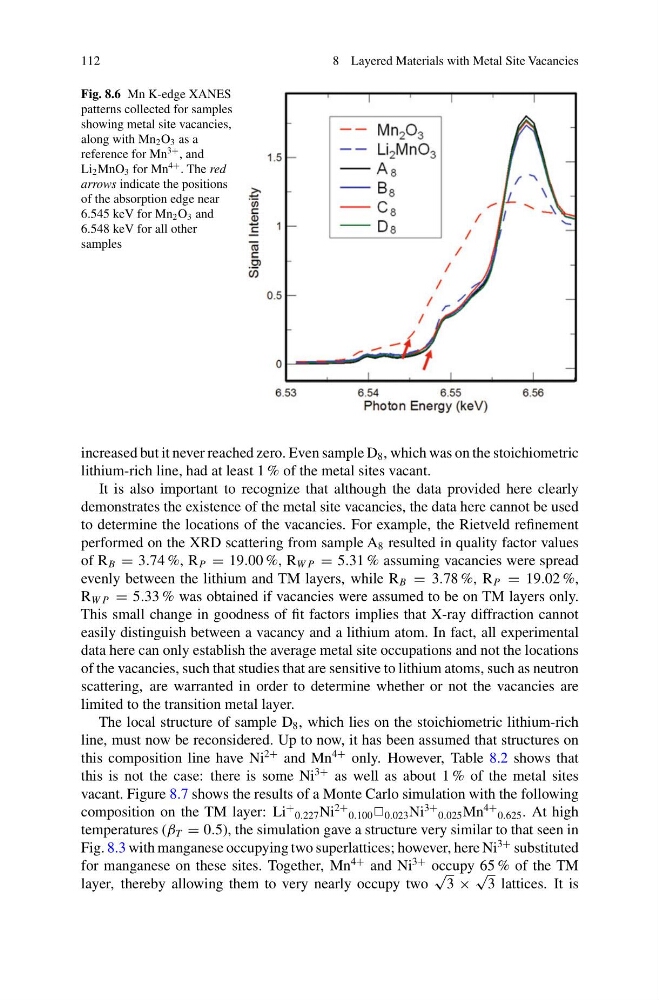
Fig. 8.6 Mn K-edge XANES
patterns collected for samples
showing metal site vacancies,
along with Mn 2 O 3 as a
reference for Mn
3+ , and
Li 2 MnO 3 for Mn
4+ . The red
arrows indicate the positions
of the absorption edge near
6.545 keV for Mn 2 O 3 and
6.548 keV for all other
samples
increased but it never reached zero. Even sample D 8 , which was on the stoichiometric
lithium-rich line, had at least 1 % of the metal sites vacant.
It is also important to recognize that although the data provided here clearly
demonstrates the existence of the metal site vacancies, the data here cannot be used
to determine the locations of the vacancies. For example, the Rietveld refinement
performed on the XRD scattering from sample A 8 resulted in quality factor values
of R B = 3.74 %, R P = 19.00 %, R W P = 5.31 % assuming vacancies were spread
evenly between the lithium and TM layers, while R B = 3.78 %, R P = 19.02 %,
R W P = 5.33 % was obtained if vacancies were assumed to be on TM layers only.
This small change in goodness of fit factors implies that X-ray diffraction cannot
easily distinguish between a vacancy and a lithium atom. In fact, all experimental
data here can only establish the average metal site occupations and not the locations
of the vacancies, such that studies that are sensitive to lithium atoms, such as neutron
scattering, are warranted in order to determine whether or not the vacancies are
limited to the transition metal layer.
The local structure of sample D 8 , which lies on the stoichiometric lithium-rich
line, must now be reconsidered. Up to now, it has been assumed that structures on
this composition line have Ni
2+ and Mn
4+ only. However, Table 8.2 shows that
this is not the case: there is some Ni
3+ as well as about 1 % of the metal sites
vacant. Figure 8.7 shows the results of a Monte Carlo simulation with the following
composition on the TM layer: Li
+
0.227 Ni
2+
0.100 P 0.023 Ni
3+
0.025 Mn
4+
0.625 . At high
temperatures (β T = 0.5), the simulation gave a structure very similar to that seen in
Fig. 8.3 with manganese occupying two superlattices; however, here Ni
3+ substituted
for manganese on these sites. Together, Mn
4+ and Ni
3+ occupy 65 % of the TM
layer, thereby allowing them to very nearly occupy two
√
3 ×
√
3 lattices. It is
8 Layered Materials with Metal Site Vacancies
Fig. 8.6 Mn K-edge XANES
patterns collected for samples
showing metal site vacancies,
along with Mn 2 O 3 as a
reference for Mn
3+ , and
Li 2 MnO 3 for Mn
4+ . The red
arrows indicate the positions
of the absorption edge near
6.545 keV for Mn 2 O 3 and
6.548 keV for all other
samples
increased but it never reached zero. Even sample D 8 , which was on the stoichiometric
lithium-rich line, had at least 1 % of the metal sites vacant.
It is also important to recognize that although the data provided here clearly
demonstrates the existence of the metal site vacancies, the data here cannot be used
to determine the locations of the vacancies. For example, the Rietveld refinement
performed on the XRD scattering from sample A 8 resulted in quality factor values
of R B = 3.74 %, R P = 19.00 %, R W P = 5.31 % assuming vacancies were spread
evenly between the lithium and TM layers, while R B = 3.78 %, R P = 19.02 %,
R W P = 5.33 % was obtained if vacancies were assumed to be on TM layers only.
This small change in goodness of fit factors implies that X-ray diffraction cannot
easily distinguish between a vacancy and a lithium atom. In fact, all experimental
data here can only establish the average metal site occupations and not the locations
of the vacancies, such that studies that are sensitive to lithium atoms, such as neutron
scattering, are warranted in order to determine whether or not the vacancies are
limited to the transition metal layer.
The local structure of sample D 8 , which lies on the stoichiometric lithium-rich
line, must now be reconsidered. Up to now, it has been assumed that structures on
this composition line have Ni
2+ and Mn
4+ only. However, Table 8.2 shows that
this is not the case: there is some Ni
3+ as well as about 1 % of the metal sites
vacant. Figure 8.7 shows the results of a Monte Carlo simulation with the following
composition on the TM layer: Li
+
0.227 Ni
2+
0.100 P 0.023 Ni
3+
0.025 Mn
4+
0.625 . At high
temperatures (β T = 0.5), the simulation gave a structure very similar to that seen in
Fig. 8.3 with manganese occupying two superlattices; however, here Ni
3+ substituted
for manganese on these sites. Together, Mn
4+ and Ni
3+ occupy 65 % of the TM
layer, thereby allowing them to very nearly occupy two
√
3 ×
√
3 lattices. It is