

8.4 Vacancy Measurements
111
Table 8.1 Metal molar fractions for samples A 8 –D 8 and Li 2 MnO 3 discussed in this chapter. For
Li 2 MnO 3 the expected composition is shown, while for A 8 –D 8 the actual compositions obtained
by elemental analysis are shown
Sample
Li
Mn
Ni
A 8
0.568
0.359
0.073
B 8
0.592
0.339
0.069
C 8
0.612
0.323
0.065
D 8
0.621
0.316
0.063
Li 2 MnO 3
0.666
0.333
0
Table 8.2 Results for Rietveld refinement, pycnometry, and redox titrations
Property
A 8
B 8
C 8
D 8
Li 2 MnO
b
3
XRD
a (Å)
2.8582 (1)
2.8558 (2)
2.8542 (2)
2.8536 (2)
a = 4.9318 (3)
c (Å)
14.298 (1)
14.283 (2)
14.255 (3)
14.253 (3)
b = 8.5375 (5)
c = 5.0299 (3)
β = 109.32 (1)
◦
Ni Li (%)
3.1 (3)
2.1 (2)
2.3 (2)
2.7 (2)
—
vacancies (%)
6.9 (1.8)
8.1 (1.3)
2.7 (1.3)
1.0 (1.5)
—
Pycnometry
density (g/mL)
4.138 (14)
4.089 (9)
4.0884 (12)
4.051 (7)
3.868 (7)
vacancies (%)
7.0 (5)
5.2 (4)
2.2 (5)
2.0 (5)
0.6 (3)
Redox titration
Mn
3.99 (1)
3.98 (1)
4.00
4.00
3.99 (1)
Ni
a
2.00
2.00
2.05(5)
2.20(5)
—
vacancies (%)
6.82 (16)
3.81 (16)
1.83 (15)
1.17 (15)
0.17 (17)
a The average nickel oxidation state was assumed to be 2.0 unless the manganese value was measured
to be greater than 4.0. In the later case, the manganese oxidation state was assumed to be 4.0 with
the nickel state > 2.0
b The Li 2 MnO 3 XRD scan was fit as monoclinic, ignoring peaks between 20 and 33
◦ and the
crystallographic density assuming no vacancies is 3.882 g/mL
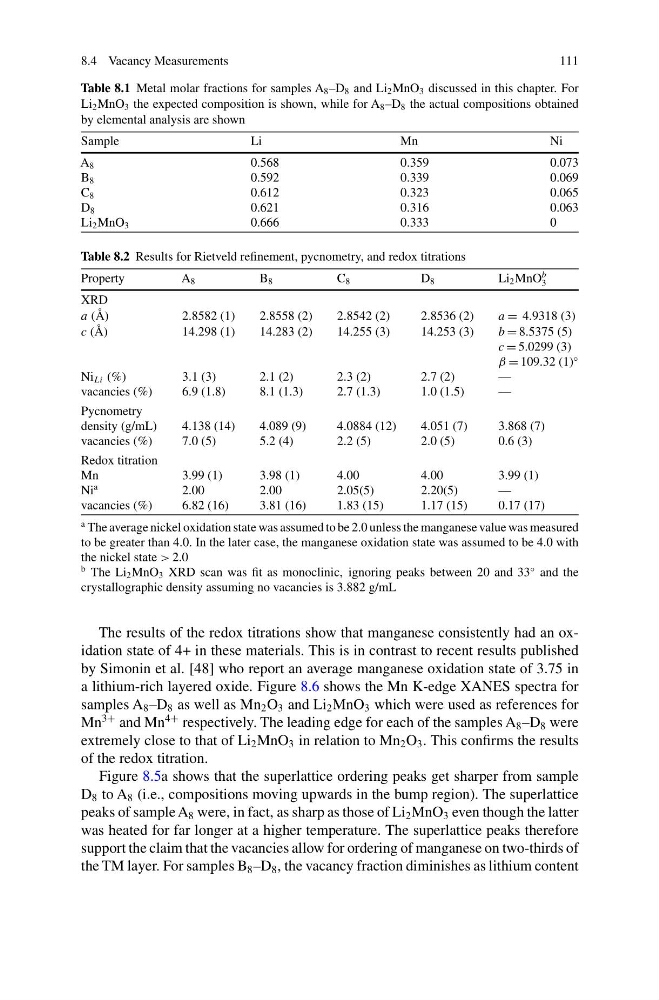
The results of the redox titrations show that manganese consistently had an oxidation state of 4+ in these materials. This is in contrast to recent results published
by Simonin et al. [48] who report an average manganese oxidation state of 3.75 in
a lithium-rich layered oxide. Figure 8.6 shows the Mn K-edge XANES spectra for
samples A 8 –D 8 as well as Mn 2 O 3 and Li 2 MnO 3 which were used as references for
Mn
3+ and Mn
4+ respectively. The leading edge for each of the samples A 8 –D 8 were
extremely close to that of Li 2 MnO 3 in relation to Mn 2 O 3 . This confirms the results
of the redox titration.
Figure 8.5a shows that the superlattice ordering peaks get sharper from sample
D 8 to A 8 (i.e., compositions moving upwards in the bump region). The superlattice
peaks of sample A 8 were, in fact, as sharp as those of Li 2 MnO 3 even though the latter
was heated for far longer at a higher temperature. The superlattice peaks therefore
support the claim that the vacancies allow for ordering of manganese on two-thirds of
the TM layer. For samples B 8 –D 8 , the vacancy fraction diminishes as lithium content
111
Table 8.1 Metal molar fractions for samples A 8 –D 8 and Li 2 MnO 3 discussed in this chapter. For
Li 2 MnO 3 the expected composition is shown, while for A 8 –D 8 the actual compositions obtained
by elemental analysis are shown
Sample
Li
Mn
Ni
A 8
0.568
0.359
0.073
B 8
0.592
0.339
0.069
C 8
0.612
0.323
0.065
D 8
0.621
0.316
0.063
Li 2 MnO 3
0.666
0.333
0
Table 8.2 Results for Rietveld refinement, pycnometry, and redox titrations
Property
A 8
B 8
C 8
D 8
Li 2 MnO
b
3
XRD
a (Å)
2.8582 (1)
2.8558 (2)
2.8542 (2)
2.8536 (2)
a = 4.9318 (3)
c (Å)
14.298 (1)
14.283 (2)
14.255 (3)
14.253 (3)
b = 8.5375 (5)
c = 5.0299 (3)
β = 109.32 (1)
◦
Ni Li (%)
3.1 (3)
2.1 (2)
2.3 (2)
2.7 (2)
—
vacancies (%)
6.9 (1.8)
8.1 (1.3)
2.7 (1.3)
1.0 (1.5)
—
Pycnometry
density (g/mL)
4.138 (14)
4.089 (9)
4.0884 (12)
4.051 (7)
3.868 (7)
vacancies (%)
7.0 (5)
5.2 (4)
2.2 (5)
2.0 (5)
0.6 (3)
Redox titration
Mn
3.99 (1)
3.98 (1)
4.00
4.00
3.99 (1)
Ni
a
2.00
2.00
2.05(5)
2.20(5)
—
vacancies (%)
6.82 (16)
3.81 (16)
1.83 (15)
1.17 (15)
0.17 (17)
a The average nickel oxidation state was assumed to be 2.0 unless the manganese value was measured
to be greater than 4.0. In the later case, the manganese oxidation state was assumed to be 4.0 with
the nickel state > 2.0
b The Li 2 MnO 3 XRD scan was fit as monoclinic, ignoring peaks between 20 and 33
◦ and the
crystallographic density assuming no vacancies is 3.882 g/mL
The results of the redox titrations show that manganese consistently had an oxidation state of 4+ in these materials. This is in contrast to recent results published
by Simonin et al. [48] who report an average manganese oxidation state of 3.75 in
a lithium-rich layered oxide. Figure 8.6 shows the Mn K-edge XANES spectra for
samples A 8 –D 8 as well as Mn 2 O 3 and Li 2 MnO 3 which were used as references for
Mn
3+ and Mn
4+ respectively. The leading edge for each of the samples A 8 –D 8 were
extremely close to that of Li 2 MnO 3 in relation to Mn 2 O 3 . This confirms the results
of the redox titration.
Figure 8.5a shows that the superlattice ordering peaks get sharper from sample
D 8 to A 8 (i.e., compositions moving upwards in the bump region). The superlattice
peaks of sample A 8 were, in fact, as sharp as those of Li 2 MnO 3 even though the latter
was heated for far longer at a higher temperature. The superlattice peaks therefore
support the claim that the vacancies allow for ordering of manganese on two-thirds of
the TM layer. For samples B 8 –D 8 , the vacancy fraction diminishes as lithium content