

110
8 Layered Materials with Metal Site Vacancies
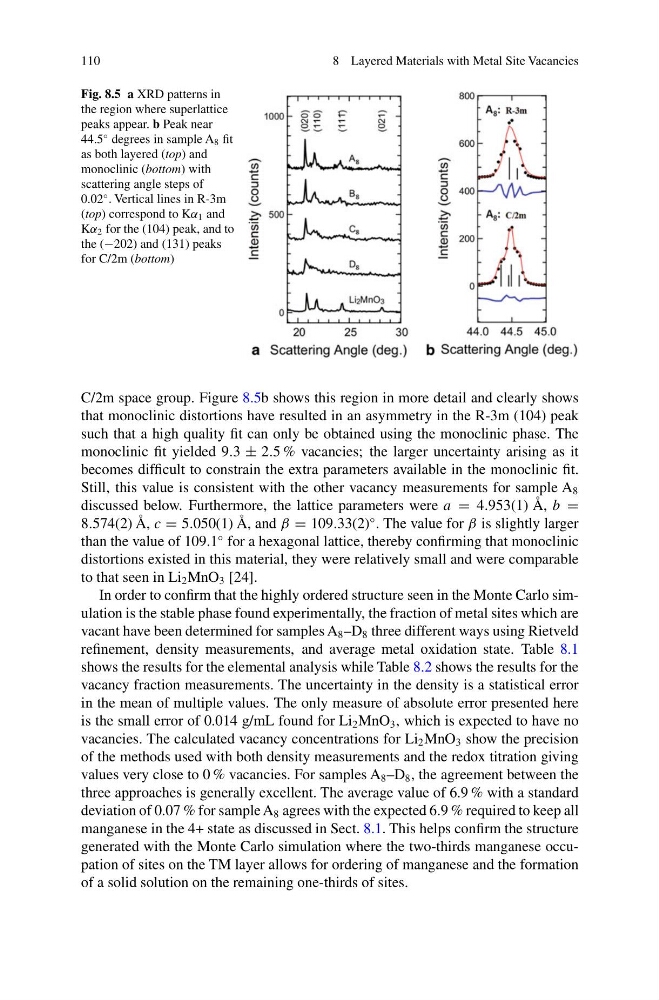
Fig. 8.5 a XRD patterns in
the region where superlattice
peaks appear. b Peak near
44.5
◦ degrees in sample A 8 fit
as both layered (top) and
monoclinic (bottom) with
scattering angle steps of
0.02
◦ . Vertical lines in R-3m
(top) correspond to Kα 1 and
Kα 2 for the (104) peak, and to
the (−202) and (131) peaks
for C/2m (bottom)
C/2m space group. Figure 8.5b shows this region in more detail and clearly shows
that monoclinic distortions have resulted in an asymmetry in the R-3m (104) peak
such that a high quality fit can only be obtained using the monoclinic phase. The
monoclinic fit yielded 9.3 ± 2.5 % vacancies; the larger uncertainty arising as it
becomes difficult to constrain the extra parameters available in the monoclinic fit.
Still, this value is consistent with the other vacancy measurements for sample A 8
discussed below. Furthermore, the lattice parameters were a = 4.953(1) Å, b =
8.574(2) Å, c = 5.050(1) Å, and β = 109.33(2)
◦ . The value for β is slightly larger
than the value of 109.1
◦ for a hexagonal lattice, thereby confirming that monoclinic
distortions existed in this material, they were relatively small and were comparable
to that seen in Li 2 MnO 3 [24].
In order to confirm that the highly ordered structure seen in the Monte Carlo simulation is the stable phase found experimentally, the fraction of metal sites which are
vacant have been determined for samples A 8 –D 8 three different ways using Rietveld
refinement, density measurements, and average metal oxidation state. Table 8.1
shows the results for the elemental analysis while Table 8.2 shows the results for the
vacancy fraction measurements. The uncertainty in the density is a statistical error
in the mean of multiple values. The only measure of absolute error presented here
is the small error of 0.014 g/mL found for Li 2 MnO 3 , which is expected to have no
vacancies. The calculated vacancy concentrations for Li 2 MnO 3 show the precision
of the methods used with both density measurements and the redox titration giving
values very close to 0 % vacancies. For samples A 8 –D 8 , the agreement between the
three approaches is generally excellent. The average value of 6.9 % with a standard
deviation of 0.07 % for sample A 8 agrees with the expected 6.9 % required to keep all
manganese in the 4+ state as discussed in Sect. 8.1. This helps confirm the structure
generated with the Monte Carlo simulation where the two-thirds manganese occupation of sites on the TM layer allows for ordering of manganese and the formation
of a solid solution on the remaining one-thirds of sites.
8 Layered Materials with Metal Site Vacancies
Fig. 8.5 a XRD patterns in
the region where superlattice
peaks appear. b Peak near
44.5
◦ degrees in sample A 8 fit
as both layered (top) and
monoclinic (bottom) with
scattering angle steps of
0.02
◦ . Vertical lines in R-3m
(top) correspond to Kα 1 and
Kα 2 for the (104) peak, and to
the (−202) and (131) peaks
for C/2m (bottom)
C/2m space group. Figure 8.5b shows this region in more detail and clearly shows
that monoclinic distortions have resulted in an asymmetry in the R-3m (104) peak
such that a high quality fit can only be obtained using the monoclinic phase. The
monoclinic fit yielded 9.3 ± 2.5 % vacancies; the larger uncertainty arising as it
becomes difficult to constrain the extra parameters available in the monoclinic fit.
Still, this value is consistent with the other vacancy measurements for sample A 8
discussed below. Furthermore, the lattice parameters were a = 4.953(1) Å, b =
8.574(2) Å, c = 5.050(1) Å, and β = 109.33(2)
◦ . The value for β is slightly larger
than the value of 109.1
◦ for a hexagonal lattice, thereby confirming that monoclinic
distortions existed in this material, they were relatively small and were comparable
to that seen in Li 2 MnO 3 [24].
In order to confirm that the highly ordered structure seen in the Monte Carlo simulation is the stable phase found experimentally, the fraction of metal sites which are
vacant have been determined for samples A 8 –D 8 three different ways using Rietveld
refinement, density measurements, and average metal oxidation state. Table 8.1
shows the results for the elemental analysis while Table 8.2 shows the results for the
vacancy fraction measurements. The uncertainty in the density is a statistical error
in the mean of multiple values. The only measure of absolute error presented here
is the small error of 0.014 g/mL found for Li 2 MnO 3 , which is expected to have no
vacancies. The calculated vacancy concentrations for Li 2 MnO 3 show the precision
of the methods used with both density measurements and the redox titration giving
values very close to 0 % vacancies. For samples A 8 –D 8 , the agreement between the
three approaches is generally excellent. The average value of 6.9 % with a standard
deviation of 0.07 % for sample A 8 agrees with the expected 6.9 % required to keep all
manganese in the 4+ state as discussed in Sect. 8.1. This helps confirm the structure
generated with the Monte Carlo simulation where the two-thirds manganese occupation of sites on the TM layer allows for ordering of manganese and the formation
of a solid solution on the remaining one-thirds of sites.