

8.2 Experimental Design
107
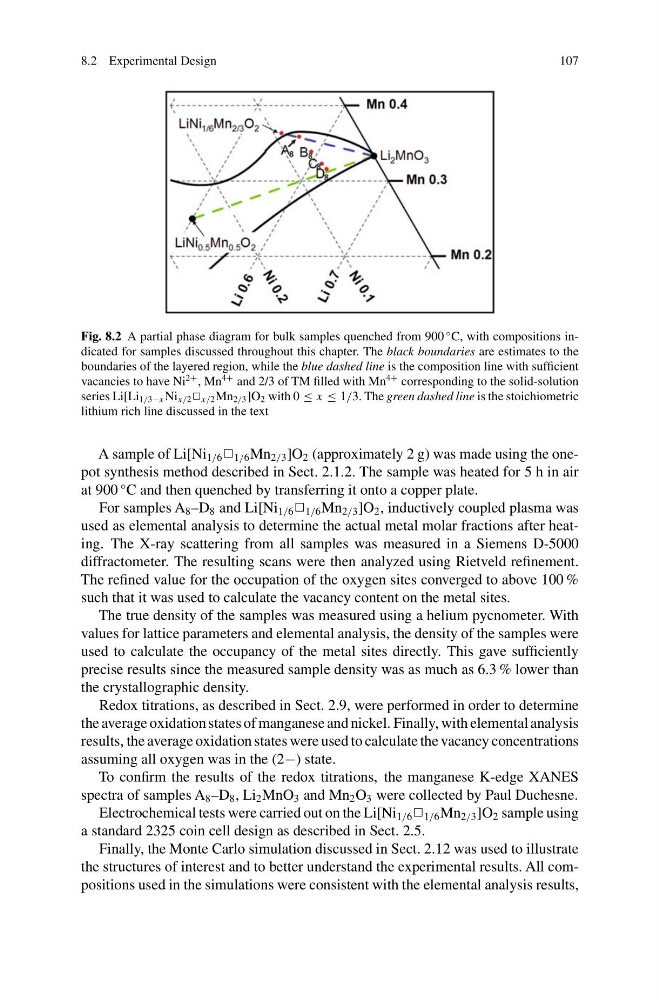
Fig. 8.2 A partial phase diagram for bulk samples quenched from 900
◦ C, with compositions indicated for samples discussed throughout this chapter. The black boundaries are estimates to the
boundaries of the layered region, while the blue dashed line is the composition line with sufficient
vacancies to have Ni
2+ , Mn
4+ and 2/3 of TM filled with Mn
4+ corresponding to the solid-solution
series Li[Li 1/3−x Ni x/2 P x/2 Mn 2/3 ]O 2 with 0 ≤ x ≤ 1/3. The green dashed line is the stoichiometric
lithium rich line discussed in the text
A sample of Li[Ni 1/6 P 1/6 Mn 2/3 ]O 2 (approximately 2 g) was made using the onepot synthesis method described in Sect. 2.1.2. The sample was heated for 5 h in air
at 900
◦ C and then quenched by transferring it onto a copper plate.
For samples A 8 –D 8 and Li[Ni 1/6 P 1/6 Mn 2/3 ]O 2 , inductively coupled plasma was
used as elemental analysis to determine the actual metal molar fractions after heating. The X-ray scattering from all samples was measured in a Siemens D-5000
diffractometer. The resulting scans were then analyzed using Rietveld refinement.
The refined value for the occupation of the oxygen sites converged to above 100 %
such that it was used to calculate the vacancy content on the metal sites.
The true density of the samples was measured using a helium pycnometer. With
values for lattice parameters and elemental analysis, the density of the samples were
used to calculate the occupancy of the metal sites directly. This gave sufficiently
precise results since the measured sample density was as much as 6.3 % lower than
the crystallographic density.
Redox titrations, as described in Sect. 2.9, were performed in order to determine
the average oxidation states of manganese and nickel. Finally, with elemental analysis
results, the average oxidation states were used to calculate the vacancy concentrations
assuming all oxygen was in the (2−) state.
To confirm the results of the redox titrations, the manganese K-edge XANES
spectra of samples A 8 –D 8 , Li 2 MnO 3 and Mn 2 O 3 were collected by Paul Duchesne.
Electrochemical tests were carried out on the Li[Ni 1/6 P 1/6 Mn 2/3 ]O 2 sample using
a standard 2325 coin cell design as described in Sect. 2.5.
Finally, the Monte Carlo simulation discussed in Sect. 2.12 was used to illustrate
the structures of interest and to better understand the experimental results. All compositions used in the simulations were consistent with the elemental analysis results,
107
Fig. 8.2 A partial phase diagram for bulk samples quenched from 900
◦ C, with compositions indicated for samples discussed throughout this chapter. The black boundaries are estimates to the
boundaries of the layered region, while the blue dashed line is the composition line with sufficient
vacancies to have Ni
2+ , Mn
4+ and 2/3 of TM filled with Mn
4+ corresponding to the solid-solution
series Li[Li 1/3−x Ni x/2 P x/2 Mn 2/3 ]O 2 with 0 ≤ x ≤ 1/3. The green dashed line is the stoichiometric
lithium rich line discussed in the text
A sample of Li[Ni 1/6 P 1/6 Mn 2/3 ]O 2 (approximately 2 g) was made using the onepot synthesis method described in Sect. 2.1.2. The sample was heated for 5 h in air
at 900
◦ C and then quenched by transferring it onto a copper plate.
For samples A 8 –D 8 and Li[Ni 1/6 P 1/6 Mn 2/3 ]O 2 , inductively coupled plasma was
used as elemental analysis to determine the actual metal molar fractions after heating. The X-ray scattering from all samples was measured in a Siemens D-5000
diffractometer. The resulting scans were then analyzed using Rietveld refinement.
The refined value for the occupation of the oxygen sites converged to above 100 %
such that it was used to calculate the vacancy content on the metal sites.
The true density of the samples was measured using a helium pycnometer. With
values for lattice parameters and elemental analysis, the density of the samples were
used to calculate the occupancy of the metal sites directly. This gave sufficiently
precise results since the measured sample density was as much as 6.3 % lower than
the crystallographic density.
Redox titrations, as described in Sect. 2.9, were performed in order to determine
the average oxidation states of manganese and nickel. Finally, with elemental analysis
results, the average oxidation states were used to calculate the vacancy concentrations
assuming all oxygen was in the (2−) state.
To confirm the results of the redox titrations, the manganese K-edge XANES
spectra of samples A 8 –D 8 , Li 2 MnO 3 and Mn 2 O 3 were collected by Paul Duchesne.
Electrochemical tests were carried out on the Li[Ni 1/6 P 1/6 Mn 2/3 ]O 2 sample using
a standard 2325 coin cell design as described in Sect. 2.5.
Finally, the Monte Carlo simulation discussed in Sect. 2.12 was used to illustrate
the structures of interest and to better understand the experimental results. All compositions used in the simulations were consistent with the elemental analysis results,