

106
8 Layered Materials with Metal Site Vacancies
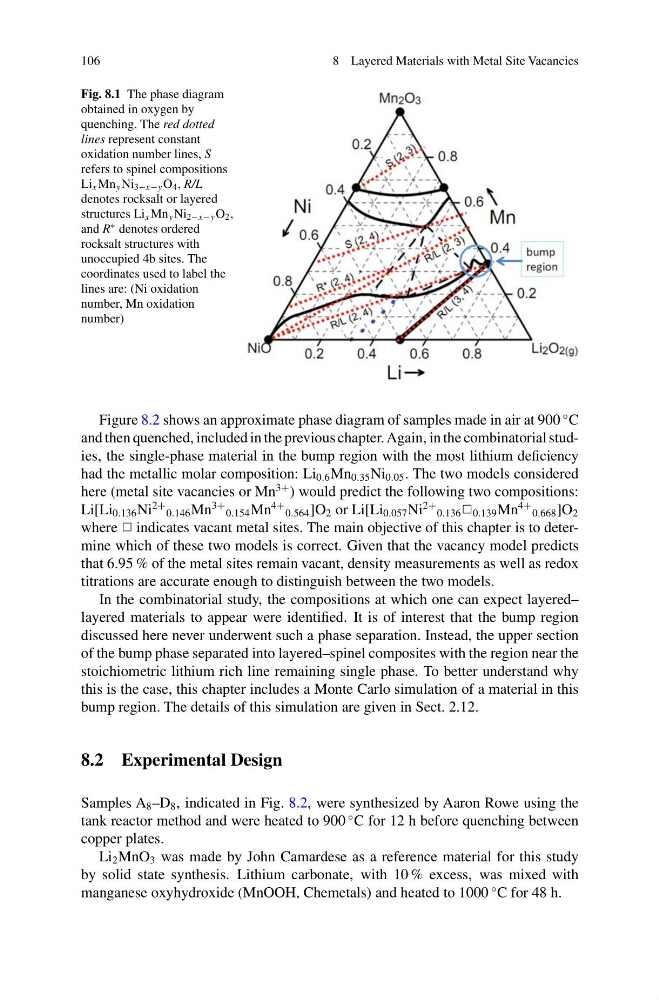
Fig. 8.1 The phase diagram
obtained in oxygen by
quenching. The red dotted
lines represent constant
oxidation number lines, S
refers to spinel compositions
Li x Mn y Ni 3−x−y O 4 , R/L
denotes rocksalt or layered
structures Li x Mn y Ni 2−x−y O 2 ,
and R
∗ denotes ordered
rocksalt structures with
unoccupied 4b sites. The
coordinates used to label the
lines are: (Ni oxidation
number, Mn oxidation
number)
Figure 8.2 shows an approximate phase diagram of samples made in air at 900
◦ C
and then quenched, included in the previous chapter. Again, in the combinatorial studies, the single-phase material in the bump region with the most lithium deficiency
had the metallic molar composition: Li 0.6 Mn 0.35 Ni 0.05 . The two models considered
here (metal site vacancies or Mn
3+ ) would predict the following two compositions:
Li[Li 0.136 Ni
2+
0.146 Mn
3+
0.154 Mn
4+
0.564 ]O 2 or Li[Li 0.057 Ni
2+
0.136 P 0.139 Mn
4+
0.668 ]O 2
where P indicates vacant metal sites. The main objective of this chapter is to determine which of these two models is correct. Given that the vacancy model predicts
that 6.95 % of the metal sites remain vacant, density measurements as well as redox
titrations are accurate enough to distinguish between the two models.
In the combinatorial study, the compositions at which one can expect layered–
layered materials to appear were identified. It is of interest that the bump region
discussed here never underwent such a phase separation. Instead, the upper section
of the bump phase separated into layered–spinel composites with the region near the
stoichiometric lithium rich line remaining single phase. To better understand why
this is the case, this chapter includes a Monte Carlo simulation of a material in this
bump region. The details of this simulation are given in Sect. 2.12.
8.2 Experimental Design
Samples A 8 –D 8 , indicated in Fig. 8.2, were synthesized by Aaron Rowe using the
tank reactor method and were heated to 900
◦ C for 12 h before quenching between
copper plates.
Li 2 MnO 3 was made by John Camardese as a reference material for this study
by solid state synthesis. Lithium carbonate, with 10 % excess, was mixed with
manganese oxyhydroxide (MnOOH, Chemetals) and heated to 1000
◦ C for 48 h.
8 Layered Materials with Metal Site Vacancies
Fig. 8.1 The phase diagram
obtained in oxygen by
quenching. The red dotted
lines represent constant
oxidation number lines, S
refers to spinel compositions
Li x Mn y Ni 3−x−y O 4 , R/L
denotes rocksalt or layered
structures Li x Mn y Ni 2−x−y O 2 ,
and R
∗ denotes ordered
rocksalt structures with
unoccupied 4b sites. The
coordinates used to label the
lines are: (Ni oxidation
number, Mn oxidation
number)
Figure 8.2 shows an approximate phase diagram of samples made in air at 900
◦ C
and then quenched, included in the previous chapter. Again, in the combinatorial studies, the single-phase material in the bump region with the most lithium deficiency
had the metallic molar composition: Li 0.6 Mn 0.35 Ni 0.05 . The two models considered
here (metal site vacancies or Mn
3+ ) would predict the following two compositions:
Li[Li 0.136 Ni
2+
0.146 Mn
3+
0.154 Mn
4+
0.564 ]O 2 or Li[Li 0.057 Ni
2+
0.136 P 0.139 Mn
4+
0.668 ]O 2
where P indicates vacant metal sites. The main objective of this chapter is to determine which of these two models is correct. Given that the vacancy model predicts
that 6.95 % of the metal sites remain vacant, density measurements as well as redox
titrations are accurate enough to distinguish between the two models.
In the combinatorial study, the compositions at which one can expect layered–
layered materials to appear were identified. It is of interest that the bump region
discussed here never underwent such a phase separation. Instead, the upper section
of the bump phase separated into layered–spinel composites with the region near the
stoichiometric lithium rich line remaining single phase. To better understand why
this is the case, this chapter includes a Monte Carlo simulation of a material in this
bump region. The details of this simulation are given in Sect. 2.12.
8.2 Experimental Design
Samples A 8 –D 8 , indicated in Fig. 8.2, were synthesized by Aaron Rowe using the
tank reactor method and were heated to 900
◦ C for 12 h before quenching between
copper plates.
Li 2 MnO 3 was made by John Camardese as a reference material for this study
by solid state synthesis. Lithium carbonate, with 10 % excess, was mixed with
manganese oxyhydroxide (MnOOH, Chemetals) and heated to 1000
◦ C for 48 h.