

7.3 Structural Results
99
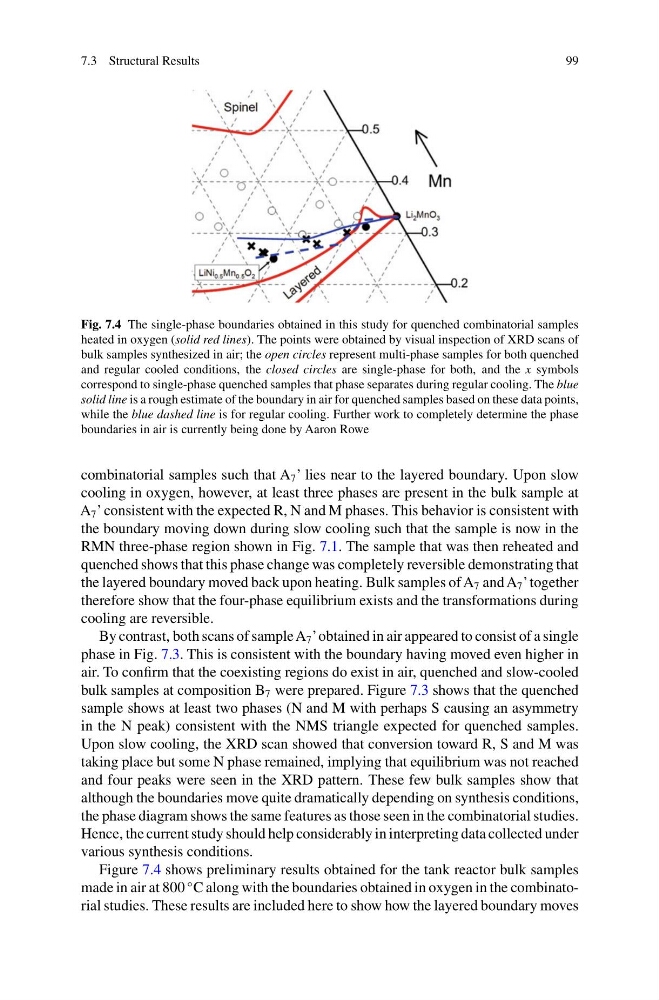
Fig. 7.4 The single-phase boundaries obtained in this study for quenched combinatorial samples
heated in oxygen (solid red lines). The points were obtained by visual inspection of XRD scans of
bulk samples synthesized in air; the open circles represent multi-phase samples for both quenched
and regular cooled conditions, the closed circles are single-phase for both, and the x symbols
correspond to single-phase quenched samples that phase separates during regular cooling. The blue
solid line is a rough estimate of the boundary in air for quenched samples based on these data points,
while the blue dashed line is for regular cooling. Further work to completely determine the phase
boundaries in air is currently being done by Aaron Rowe
combinatorial samples such that A 7 ’ lies near to the layered boundary. Upon slow
cooling in oxygen, however, at least three phases are present in the bulk sample at
A 7 ’ consistent with the expected R, N and M phases. This behavior is consistent with
the boundary moving down during slow cooling such that the sample is now in the
RMN three-phase region shown in Fig. 7.1. The sample that was then reheated and
quenched shows that this phase change was completely reversible demonstrating that
the layered boundary moved back upon heating. Bulk samples of A 7 and A 7 ’ together
therefore show that the four-phase equilibrium exists and the transformations during
cooling are reversible.
By contrast, both scans of sample A 7 ’obtained in air appeared to consist of a single
phase in Fig. 7.3. This is consistent with the boundary having moved even higher in
air. To confirm that the coexisting regions do exist in air, quenched and slow-cooled
bulk samples at composition B 7 were prepared. Figure 7.3 shows that the quenched
sample shows at least two phases (N and M with perhaps S causing an asymmetry
in the N peak) consistent with the NMS triangle expected for quenched samples.
Upon slow cooling, the XRD scan showed that conversion toward R, S and M was
taking place but some N phase remained, implying that equilibrium was not reached
and four peaks were seen in the XRD pattern. These few bulk samples show that
although the boundaries move quite dramatically depending on synthesis conditions,
the phase diagram shows the same features as those seen in the combinatorial studies.
Hence, the current study should help considerably in interpreting data collected under
various synthesis conditions.
Figure 7.4 shows preliminary results obtained for the tank reactor bulk samples
made in air at 800
◦ C along with the boundaries obtained in oxygen in the combinatorial studies. These results are included here to show how the layered boundary moves
99
Fig. 7.4 The single-phase boundaries obtained in this study for quenched combinatorial samples
heated in oxygen (solid red lines). The points were obtained by visual inspection of XRD scans of
bulk samples synthesized in air; the open circles represent multi-phase samples for both quenched
and regular cooled conditions, the closed circles are single-phase for both, and the x symbols
correspond to single-phase quenched samples that phase separates during regular cooling. The blue
solid line is a rough estimate of the boundary in air for quenched samples based on these data points,
while the blue dashed line is for regular cooling. Further work to completely determine the phase
boundaries in air is currently being done by Aaron Rowe
combinatorial samples such that A 7 ’ lies near to the layered boundary. Upon slow
cooling in oxygen, however, at least three phases are present in the bulk sample at
A 7 ’ consistent with the expected R, N and M phases. This behavior is consistent with
the boundary moving down during slow cooling such that the sample is now in the
RMN three-phase region shown in Fig. 7.1. The sample that was then reheated and
quenched shows that this phase change was completely reversible demonstrating that
the layered boundary moved back upon heating. Bulk samples of A 7 and A 7 ’ together
therefore show that the four-phase equilibrium exists and the transformations during
cooling are reversible.
By contrast, both scans of sample A 7 ’obtained in air appeared to consist of a single
phase in Fig. 7.3. This is consistent with the boundary having moved even higher in
air. To confirm that the coexisting regions do exist in air, quenched and slow-cooled
bulk samples at composition B 7 were prepared. Figure 7.3 shows that the quenched
sample shows at least two phases (N and M with perhaps S causing an asymmetry
in the N peak) consistent with the NMS triangle expected for quenched samples.
Upon slow cooling, the XRD scan showed that conversion toward R, S and M was
taking place but some N phase remained, implying that equilibrium was not reached
and four peaks were seen in the XRD pattern. These few bulk samples show that
although the boundaries move quite dramatically depending on synthesis conditions,
the phase diagram shows the same features as those seen in the combinatorial studies.
Hence, the current study should help considerably in interpreting data collected under
various synthesis conditions.
Figure 7.4 shows preliminary results obtained for the tank reactor bulk samples
made in air at 800
◦ C along with the boundaries obtained in oxygen in the combinatorial studies. These results are included here to show how the layered boundary moves