

100
7 Investigations of Bulk Li–Mn–Ni–O Samples to Confirm the Combinatorial Studies
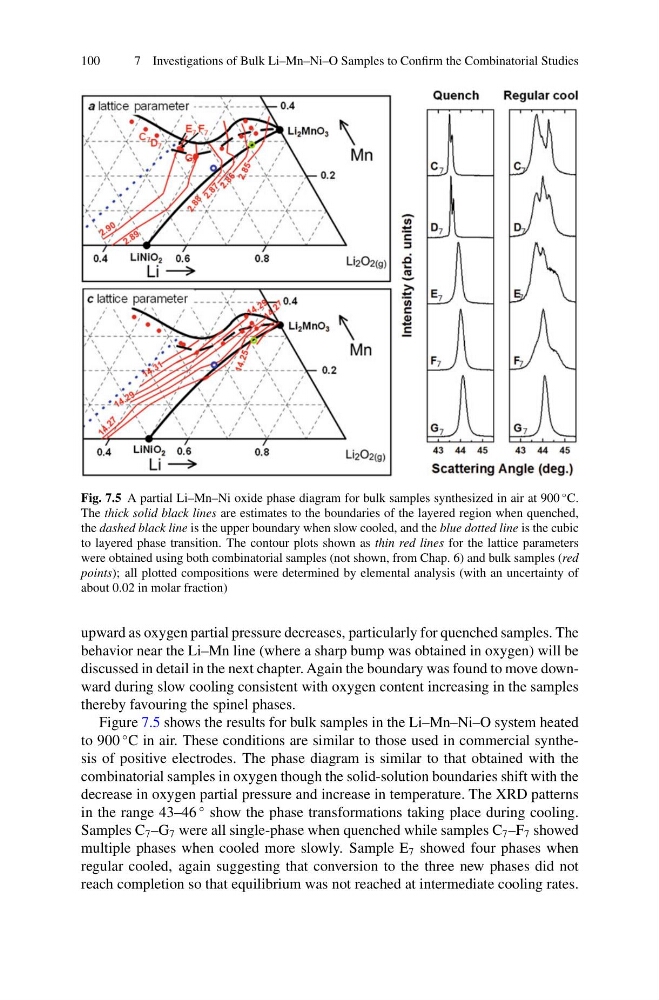
Fig. 7.5 A partial Li–Mn–Ni oxide phase diagram for bulk samples synthesized in air at 900
◦ C.
The thick solid black lines are estimates to the boundaries of the layered region when quenched,
the dashed black line is the upper boundary when slow cooled, and the blue dotted line is the cubic
to layered phase transition. The contour plots shown as thin red lines for the lattice parameters
were obtained using both combinatorial samples (not shown, from Chap. 6) and bulk samples (red
points); all plotted compositions were determined by elemental analysis (with an uncertainty of
about 0.02 in molar fraction)
upward as oxygen partial pressure decreases, particularly for quenched samples. The
behavior near the Li–Mn line (where a sharp bump was obtained in oxygen) will be
discussed in detail in the next chapter. Again the boundary was found to move downward during slow cooling consistent with oxygen content increasing in the samples
thereby favouring the spinel phases.
Figure 7.5 shows the results for bulk samples in the Li–Mn–Ni–O system heated
to 900
◦ C in air. These conditions are similar to those used in commercial synthesis of positive electrodes. The phase diagram is similar to that obtained with the
combinatorial samples in oxygen though the solid-solution boundaries shift with the
decrease in oxygen partial pressure and increase in temperature. The XRD patterns
in the range 43–46
◦ show the phase transformations taking place during cooling.
Samples C 7 –G 7 were all single-phase when quenched while samples C 7 –F 7 showed
multiple phases when cooled more slowly. Sample E 7 showed four phases when
regular cooled, again suggesting that conversion to the three new phases did not
reach completion so that equilibrium was not reached at intermediate cooling rates.
7 Investigations of Bulk Li–Mn–Ni–O Samples to Confirm the Combinatorial Studies
Fig. 7.5 A partial Li–Mn–Ni oxide phase diagram for bulk samples synthesized in air at 900
◦ C.
The thick solid black lines are estimates to the boundaries of the layered region when quenched,
the dashed black line is the upper boundary when slow cooled, and the blue dotted line is the cubic
to layered phase transition. The contour plots shown as thin red lines for the lattice parameters
were obtained using both combinatorial samples (not shown, from Chap. 6) and bulk samples (red
points); all plotted compositions were determined by elemental analysis (with an uncertainty of
about 0.02 in molar fraction)
upward as oxygen partial pressure decreases, particularly for quenched samples. The
behavior near the Li–Mn line (where a sharp bump was obtained in oxygen) will be
discussed in detail in the next chapter. Again the boundary was found to move downward during slow cooling consistent with oxygen content increasing in the samples
thereby favouring the spinel phases.
Figure 7.5 shows the results for bulk samples in the Li–Mn–Ni–O system heated
to 900
◦ C in air. These conditions are similar to those used in commercial synthesis of positive electrodes. The phase diagram is similar to that obtained with the
combinatorial samples in oxygen though the solid-solution boundaries shift with the
decrease in oxygen partial pressure and increase in temperature. The XRD patterns
in the range 43–46
◦ show the phase transformations taking place during cooling.
Samples C 7 –G 7 were all single-phase when quenched while samples C 7 –F 7 showed
multiple phases when cooled more slowly. Sample E 7 showed four phases when
regular cooled, again suggesting that conversion to the three new phases did not
reach completion so that equilibrium was not reached at intermediate cooling rates.