

98
7 Investigations of Bulk Li–Mn–Ni–O Samples to Confirm the Combinatorial Studies
Fig. 7.2 X-ray diffraction (XRD) patterns obtained for bulk sample A 7 in the Li–Mn–Ni oxide
system heated to 800
◦ C. Composition A 7 is indicated in Fig. 7.1. The right frame focuses on the
XRD peaks near 44
◦ where the four phases have one peak each. The red dashed lines represent the
positions of the N, R, S and M peaks when slow cooled after heating in oxygen. SC denotes samples
slow cooled at 1
◦ C/min, Q stands for quenching on steel while Q LN2 refers to quenching in liquid
nitrogen, and SC/Q indicates a slow cooled sample that was reheated to 800
◦ C and quenched.
Q/650 A and Q/750 A were quenched samples that were annealed at 650
◦ C and 750
◦ C respectively
for 5 h before quenching back to room temperature
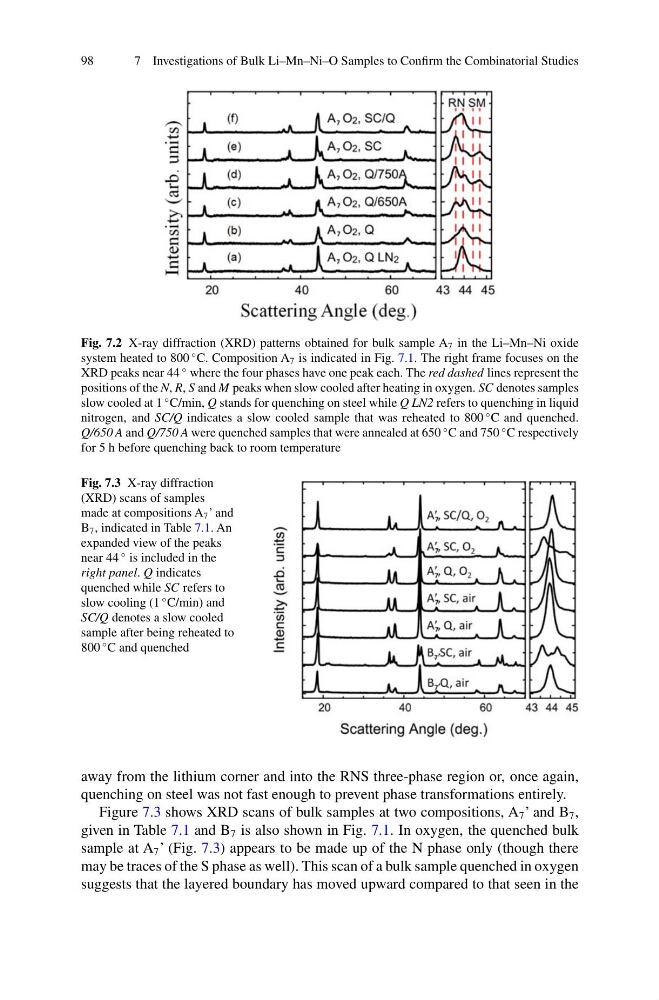
Fig. 7.3 X-ray diffraction
(XRD) scans of samples
made at compositions A 7 ’ and
B 7 , indicated in Table 7.1. An
expanded view of the peaks
near 44
◦ is included in the
right panel. Q indicates
quenched while SC refers to
slow cooling (1
◦ C/min) and
SC/Q denotes a slow cooled
sample after being reheated to
800
◦ C and quenched
away from the lithium corner and into the RNS three-phase region or, once again,
quenching on steel was not fast enough to prevent phase transformations entirely.
Figure 7.3 shows XRD scans of bulk samples at two compositions, A 7 ’ and B 7 ,
given in Table 7.1 and B 7 is also shown in Fig. 7.1. In oxygen, the quenched bulk
sample at A 7 ’ (Fig. 7.3) appears to be made up of the N phase only (though there
may be traces of the S phase as well). This scan of a bulk sample quenched in oxygen
suggests that the layered boundary has moved upward compared to that seen in the
7 Investigations of Bulk Li–Mn–Ni–O Samples to Confirm the Combinatorial Studies
Fig. 7.2 X-ray diffraction (XRD) patterns obtained for bulk sample A 7 in the Li–Mn–Ni oxide
system heated to 800
◦ C. Composition A 7 is indicated in Fig. 7.1. The right frame focuses on the
XRD peaks near 44
◦ where the four phases have one peak each. The red dashed lines represent the
positions of the N, R, S and M peaks when slow cooled after heating in oxygen. SC denotes samples
slow cooled at 1
◦ C/min, Q stands for quenching on steel while Q LN2 refers to quenching in liquid
nitrogen, and SC/Q indicates a slow cooled sample that was reheated to 800
◦ C and quenched.
Q/650 A and Q/750 A were quenched samples that were annealed at 650
◦ C and 750
◦ C respectively
for 5 h before quenching back to room temperature
Fig. 7.3 X-ray diffraction
(XRD) scans of samples
made at compositions A 7 ’ and
B 7 , indicated in Table 7.1. An
expanded view of the peaks
near 44
◦ is included in the
right panel. Q indicates
quenched while SC refers to
slow cooling (1
◦ C/min) and
SC/Q denotes a slow cooled
sample after being reheated to
800
◦ C and quenched
away from the lithium corner and into the RNS three-phase region or, once again,
quenching on steel was not fast enough to prevent phase transformations entirely.
Figure 7.3 shows XRD scans of bulk samples at two compositions, A 7 ’ and B 7 ,
given in Table 7.1 and B 7 is also shown in Fig. 7.1. In oxygen, the quenched bulk
sample at A 7 ’ (Fig. 7.3) appears to be made up of the N phase only (though there
may be traces of the S phase as well). This scan of a bulk sample quenched in oxygen
suggests that the layered boundary has moved upward compared to that seen in the