

7.3 Structural Results
97
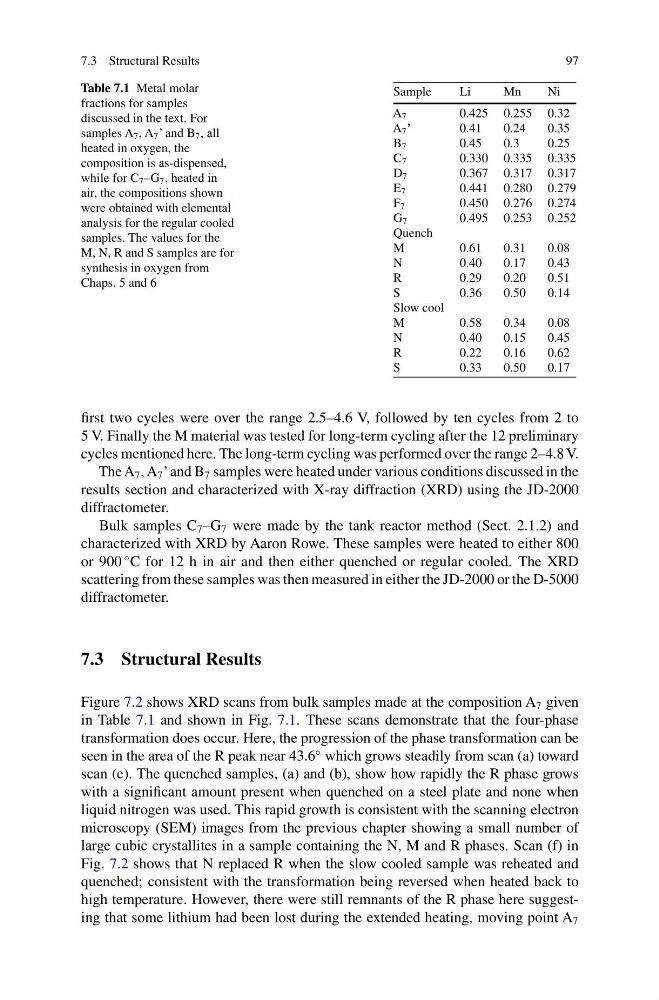
Table 7.1 Metal molar
fractions for samples
discussed in the text. For
samples A 7 , A 7 ’ and B 7 , all
heated in oxygen, the
composition is as-dispensed,
while for C 7 –G 7 , heated in
air, the compositions shown
were obtained with elemental
analysis for the regular cooled
samples. The values for the
M, N, R and S samples are for
synthesis in oxygen from
Chaps. 5 and 6
Sample
Li
Mn
Ni
A 7
0.425 0.255 0.32
A 7 ’
0.41
0.24
0.35
B 7
0.45
0.3
0.25
C 7
0.330 0.335 0.335
D 7
0.367 0.317 0.317
E 7
0.441 0.280 0.279
F 7
0.450 0.276 0.274
G 7
0.495 0.253 0.252
Quench
M
0.61
0.31
0.08
N
0.40
0.17
0.43
R
0.29
0.20
0.51
S
0.36
0.50
0.14
Slow cool
M
0.58
0.34
0.08
N
0.40
0.15
0.45
R
0.22
0.16
0.62
S
0.33
0.50
0.17
first two cycles were over the range 2.5–4.6 V, followed by ten cycles from 2 to
5 V. Finally the M material was tested for long-term cycling after the 12 preliminary
cycles mentioned here. The long-term cycling was performed over the range 2–4.8 V.
The A 7 , A 7 ’ and B 7 samples were heated under various conditions discussed in the
results section and characterized with X-ray diffraction (XRD) using the JD-2000
diffractometer.
Bulk samples C 7 –G 7 were made by the tank reactor method (Sect. 2.1.2) and
characterized with XRD by Aaron Rowe. These samples were heated to either 800
or 900
◦ C for 12 h in air and then either quenched or regular cooled. The XRD
scattering from these samples was then measured in either the JD-2000 or the D-5000
diffractometer.
7.3 Structural Results
Figure 7.2 shows XRD scans from bulk samples made at the composition A 7 given
in Table 7.1 and shown in Fig. 7.1. These scans demonstrate that the four-phase
transformation does occur. Here, the progression of the phase transformation can be
seen in the area of the R peak near 43.6
◦ which grows steadily from scan (a) toward
scan (e). The quenched samples, (a) and (b), show how rapidly the R phase grows
with a significant amount present when quenched on a steel plate and none when
liquid nitrogen was used. This rapid growth is consistent with the scanning electron
microscopy (SEM) images from the previous chapter showing a small number of
large cubic crystallites in a sample containing the N, M and R phases. Scan (f) in
Fig. 7.2 shows that N replaced R when the slow cooled sample was reheated and
quenched; consistent with the transformation being reversed when heated back to
high temperature. However, there were still remnants of the R phase here suggesting that some lithium had been lost during the extended heating, moving point A 7
97
Table 7.1 Metal molar
fractions for samples
discussed in the text. For
samples A 7 , A 7 ’ and B 7 , all
heated in oxygen, the
composition is as-dispensed,
while for C 7 –G 7 , heated in
air, the compositions shown
were obtained with elemental
analysis for the regular cooled
samples. The values for the
M, N, R and S samples are for
synthesis in oxygen from
Chaps. 5 and 6
Sample
Li
Mn
Ni
A 7
0.425 0.255 0.32
A 7 ’
0.41
0.24
0.35
B 7
0.45
0.3
0.25
C 7
0.330 0.335 0.335
D 7
0.367 0.317 0.317
E 7
0.441 0.280 0.279
F 7
0.450 0.276 0.274
G 7
0.495 0.253 0.252
Quench
M
0.61
0.31
0.08
N
0.40
0.17
0.43
R
0.29
0.20
0.51
S
0.36
0.50
0.14
Slow cool
M
0.58
0.34
0.08
N
0.40
0.15
0.45
R
0.22
0.16
0.62
S
0.33
0.50
0.17
first two cycles were over the range 2.5–4.6 V, followed by ten cycles from 2 to
5 V. Finally the M material was tested for long-term cycling after the 12 preliminary
cycles mentioned here. The long-term cycling was performed over the range 2–4.8 V.
The A 7 , A 7 ’ and B 7 samples were heated under various conditions discussed in the
results section and characterized with X-ray diffraction (XRD) using the JD-2000
diffractometer.
Bulk samples C 7 –G 7 were made by the tank reactor method (Sect. 2.1.2) and
characterized with XRD by Aaron Rowe. These samples were heated to either 800
or 900
◦ C for 12 h in air and then either quenched or regular cooled. The XRD
scattering from these samples was then measured in either the JD-2000 or the D-5000
diffractometer.
7.3 Structural Results
Figure 7.2 shows XRD scans from bulk samples made at the composition A 7 given
in Table 7.1 and shown in Fig. 7.1. These scans demonstrate that the four-phase
transformation does occur. Here, the progression of the phase transformation can be
seen in the area of the R peak near 43.6
◦ which grows steadily from scan (a) toward
scan (e). The quenched samples, (a) and (b), show how rapidly the R phase grows
with a significant amount present when quenched on a steel plate and none when
liquid nitrogen was used. This rapid growth is consistent with the scanning electron
microscopy (SEM) images from the previous chapter showing a small number of
large cubic crystallites in a sample containing the N, M and R phases. Scan (f) in
Fig. 7.2 shows that N replaced R when the slow cooled sample was reheated and
quenched; consistent with the transformation being reversed when heated back to
high temperature. However, there were still remnants of the R phase here suggesting that some lithium had been lost during the extended heating, moving point A 7