

96
7 Investigations of Bulk Li–Mn–Ni–O Samples to Confirm the Combinatorial Studies
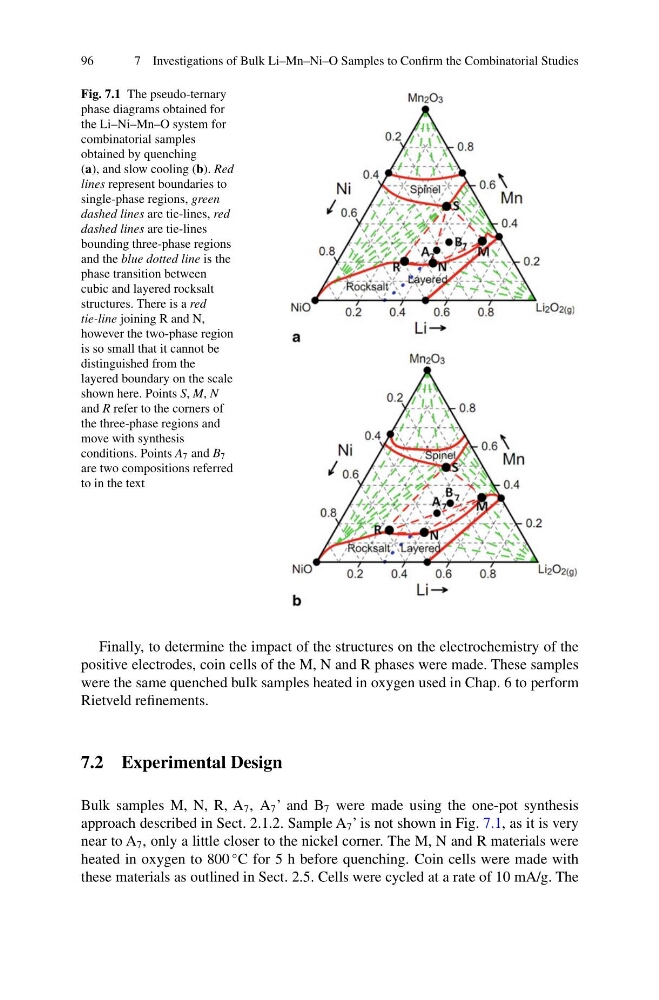
Fig. 7.1 The pseudo-ternary
phase diagrams obtained for
the Li–Ni–Mn–O system for
combinatorial samples
obtained by quenching
(a), and slow cooling (b). Red
lines represent boundaries to
single-phase regions, green
dashed lines are tie-lines, red
dashed lines are tie-lines
bounding three-phase regions
and the blue dotted line is the
phase transition between
cubic and layered rocksalt
structures. There is a red
tie-line joining R and N,
however the two-phase region
is so small that it cannot be
distinguished from the
layered boundary on the scale
shown here. Points S, M, N
and R refer to the corners of
the three-phase regions and
move with synthesis
conditions. Points A 7 and B 7
are two compositions referred
to in the text
Finally, to determine the impact of the structures on the electrochemistry of the
positive electrodes, coin cells of the M, N and R phases were made. These samples
were the same quenched bulk samples heated in oxygen used in Chap. 6 to perform
Rietveld refinements.
7.2 Experimental Design
Bulk samples M, N, R, A 7 , A 7 ’ and B 7 were made using the one-pot synthesis
approach described in Sect. 2.1.2. Sample A 7 ’ is not shown in Fig. 7.1, as it is very
near to A 7 , only a little closer to the nickel corner. The M, N and R materials were
heated in oxygen to 800
◦ C for 5 h before quenching. Coin cells were made with
these materials as outlined in Sect. 2.5. Cells were cycled at a rate of 10 mA/g. The
7 Investigations of Bulk Li–Mn–Ni–O Samples to Confirm the Combinatorial Studies
Fig. 7.1 The pseudo-ternary
phase diagrams obtained for
the Li–Ni–Mn–O system for
combinatorial samples
obtained by quenching
(a), and slow cooling (b). Red
lines represent boundaries to
single-phase regions, green
dashed lines are tie-lines, red
dashed lines are tie-lines
bounding three-phase regions
and the blue dotted line is the
phase transition between
cubic and layered rocksalt
structures. There is a red
tie-line joining R and N,
however the two-phase region
is so small that it cannot be
distinguished from the
layered boundary on the scale
shown here. Points S, M, N
and R refer to the corners of
the three-phase regions and
move with synthesis
conditions. Points A 7 and B 7
are two compositions referred
to in the text
Finally, to determine the impact of the structures on the electrochemistry of the
positive electrodes, coin cells of the M, N and R phases were made. These samples
were the same quenched bulk samples heated in oxygen used in Chap. 6 to perform
Rietveld refinements.
7.2 Experimental Design
Bulk samples M, N, R, A 7 , A 7 ’ and B 7 were made using the one-pot synthesis
approach described in Sect. 2.1.2. Sample A 7 ’ is not shown in Fig. 7.1, as it is very
near to A 7 , only a little closer to the nickel corner. The M, N and R materials were
heated in oxygen to 800
◦ C for 5 h before quenching. Coin cells were made with
these materials as outlined in Sect. 2.5. Cells were cycled at a rate of 10 mA/g. The