

90
6 Combinatorial Studies of Compositions Containing Layered Phases . . .
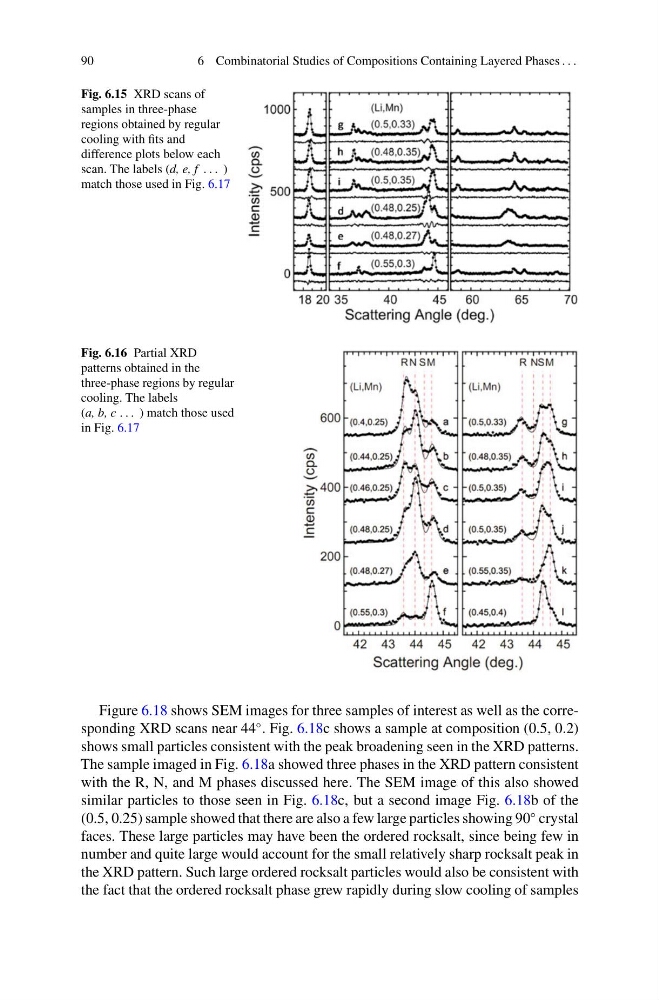
Fig. 6.15 XRD scans of
samples in three-phase
regions obtained by regular
cooling with fits and
difference plots below each
scan. The labels (d, e, f . . . )
match those used in Fig. 6.17
Fig. 6.16 Partial XRD
patterns obtained in the
three-phase regions by regular
cooling. The labels
(a, b, c . . . ) match those used
in Fig. 6.17
Figure 6.18 shows SEM images for three samples of interest as well as the corresponding XRD scans near 44
◦ . Fig. 6.18c shows a sample at composition (0.5, 0.2)
shows small particles consistent with the peak broadening seen in the XRD patterns.
The sample imaged in Fig. 6.18a showed three phases in the XRD pattern consistent
with the R, N, and M phases discussed here. The SEM image of this also showed
similar particles to those seen in Fig. 6.18c, but a second image Fig. 6.18b of the
(0.5, 0.25) sample showed that there are also a few large particles showing 90
◦ crystal
faces. These large particles may have been the ordered rocksalt, since being few in
number and quite large would account for the small relatively sharp rocksalt peak in
the XRD pattern. Such large ordered rocksalt particles would also be consistent with
the fact that the ordered rocksalt phase grew rapidly during slow cooling of samples
6 Combinatorial Studies of Compositions Containing Layered Phases . . .
Fig. 6.15 XRD scans of
samples in three-phase
regions obtained by regular
cooling with fits and
difference plots below each
scan. The labels (d, e, f . . . )
match those used in Fig. 6.17
Fig. 6.16 Partial XRD
patterns obtained in the
three-phase regions by regular
cooling. The labels
(a, b, c . . . ) match those used
in Fig. 6.17
Figure 6.18 shows SEM images for three samples of interest as well as the corresponding XRD scans near 44
◦ . Fig. 6.18c shows a sample at composition (0.5, 0.2)
shows small particles consistent with the peak broadening seen in the XRD patterns.
The sample imaged in Fig. 6.18a showed three phases in the XRD pattern consistent
with the R, N, and M phases discussed here. The SEM image of this also showed
similar particles to those seen in Fig. 6.18c, but a second image Fig. 6.18b of the
(0.5, 0.25) sample showed that there are also a few large particles showing 90
◦ crystal
faces. These large particles may have been the ordered rocksalt, since being few in
number and quite large would account for the small relatively sharp rocksalt peak in
the XRD pattern. Such large ordered rocksalt particles would also be consistent with
the fact that the ordered rocksalt phase grew rapidly during slow cooling of samples