

6.8 The Upper Boundary of the Layered Region
91
Fig. 6.17 A partial phase
diagram showing
compositions used in
Figs. 6.15 and 6.16
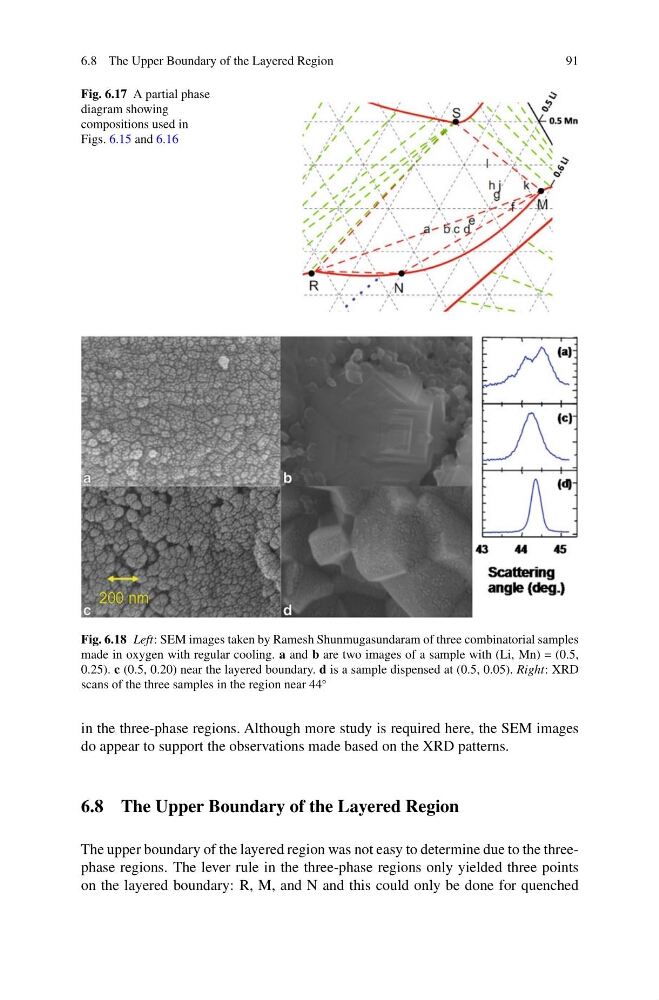
Fig. 6.18 Left: SEM images taken by Ramesh Shunmugasundaram of three combinatorial samples
made in oxygen with regular cooling. a and b are two images of a sample with (Li, Mn) = (0.5,
0.25). c (0.5, 0.20) near the layered boundary. d is a sample dispensed at (0.5, 0.05). Right: XRD
scans of the three samples in the region near 44
◦
in the three-phase regions. Although more study is required here, the SEM images
do appear to support the observations made based on the XRD patterns.
6.8 The Upper Boundary of the Layered Region
The upper boundary of the layered region was not easy to determine due to the threephase regions. The lever rule in the three-phase regions only yielded three points
on the layered boundary: R, M, and N and this could only be done for quenched
91
Fig. 6.17 A partial phase
diagram showing
compositions used in
Figs. 6.15 and 6.16
Fig. 6.18 Left: SEM images taken by Ramesh Shunmugasundaram of three combinatorial samples
made in oxygen with regular cooling. a and b are two images of a sample with (Li, Mn) = (0.5,
0.25). c (0.5, 0.20) near the layered boundary. d is a sample dispensed at (0.5, 0.05). Right: XRD
scans of the three samples in the region near 44
◦
in the three-phase regions. Although more study is required here, the SEM images
do appear to support the observations made based on the XRD patterns.
6.8 The Upper Boundary of the Layered Region
The upper boundary of the layered region was not easy to determine due to the threephase regions. The lever rule in the three-phase regions only yielded three points
on the layered boundary: R, M, and N and this could only be done for quenched