

6.7 Three-Phase Regions, Slow-Cooled
89
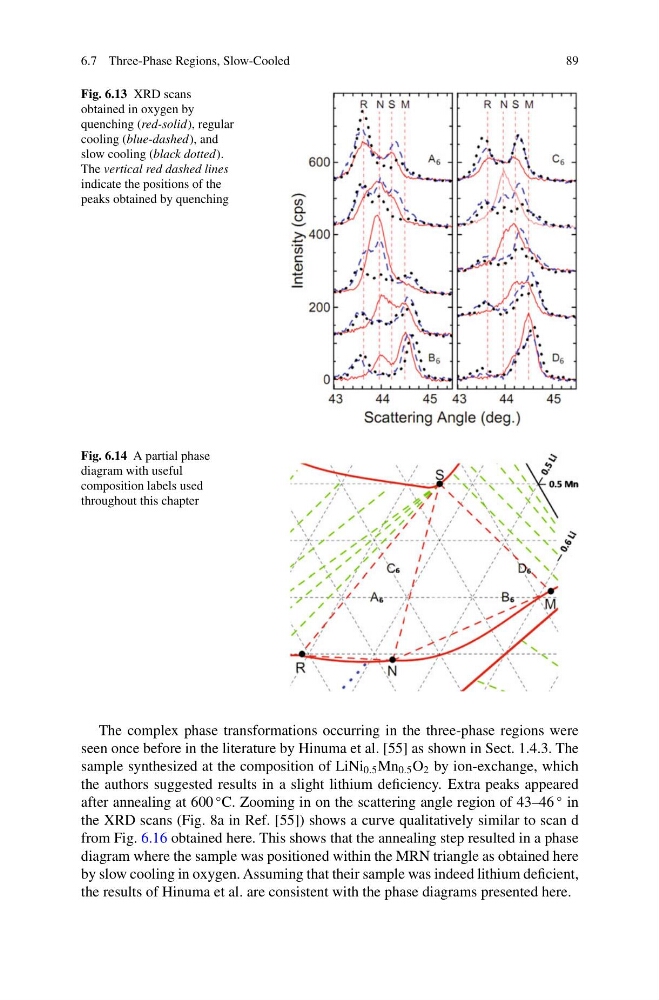
Fig. 6.13 XRD scans
obtained in oxygen by
quenching (red-solid), regular
cooling (blue-dashed), and
slow cooling (black dotted).
The vertical red dashed lines
indicate the positions of the
peaks obtained by quenching
Fig. 6.14 A partial phase
diagram with useful
composition labels used
throughout this chapter
The complex phase transformations occurring in the three-phase regions were
seen once before in the literature by Hinuma et al. [55] as shown in Sect. 1.4.3. The
sample synthesized at the composition of LiNi 0.5 Mn 0.5 O 2 by ion-exchange, which
the authors suggested results in a slight lithium deficiency. Extra peaks appeared
after annealing at 600
◦ C. Zooming in on the scattering angle region of 43–46
◦ in
the XRD scans (Fig. 8a in Ref. [55]) shows a curve qualitatively similar to scan d
from Fig. 6.16 obtained here. This shows that the annealing step resulted in a phase
diagram where the sample was positioned within the MRN triangle as obtained here
by slow cooling in oxygen. Assuming that their sample was indeed lithium deficient,
the results of Hinuma et al. are consistent with the phase diagrams presented here.
89
Fig. 6.13 XRD scans
obtained in oxygen by
quenching (red-solid), regular
cooling (blue-dashed), and
slow cooling (black dotted).
The vertical red dashed lines
indicate the positions of the
peaks obtained by quenching
Fig. 6.14 A partial phase
diagram with useful
composition labels used
throughout this chapter
The complex phase transformations occurring in the three-phase regions were
seen once before in the literature by Hinuma et al. [55] as shown in Sect. 1.4.3. The
sample synthesized at the composition of LiNi 0.5 Mn 0.5 O 2 by ion-exchange, which
the authors suggested results in a slight lithium deficiency. Extra peaks appeared
after annealing at 600
◦ C. Zooming in on the scattering angle region of 43–46
◦ in
the XRD scans (Fig. 8a in Ref. [55]) shows a curve qualitatively similar to scan d
from Fig. 6.16 obtained here. This shows that the annealing step resulted in a phase
diagram where the sample was positioned within the MRN triangle as obtained here
by slow cooling in oxygen. Assuming that their sample was indeed lithium deficient,
the results of Hinuma et al. are consistent with the phase diagrams presented here.