

88
6 Combinatorial Studies of Compositions Containing Layered Phases . . .
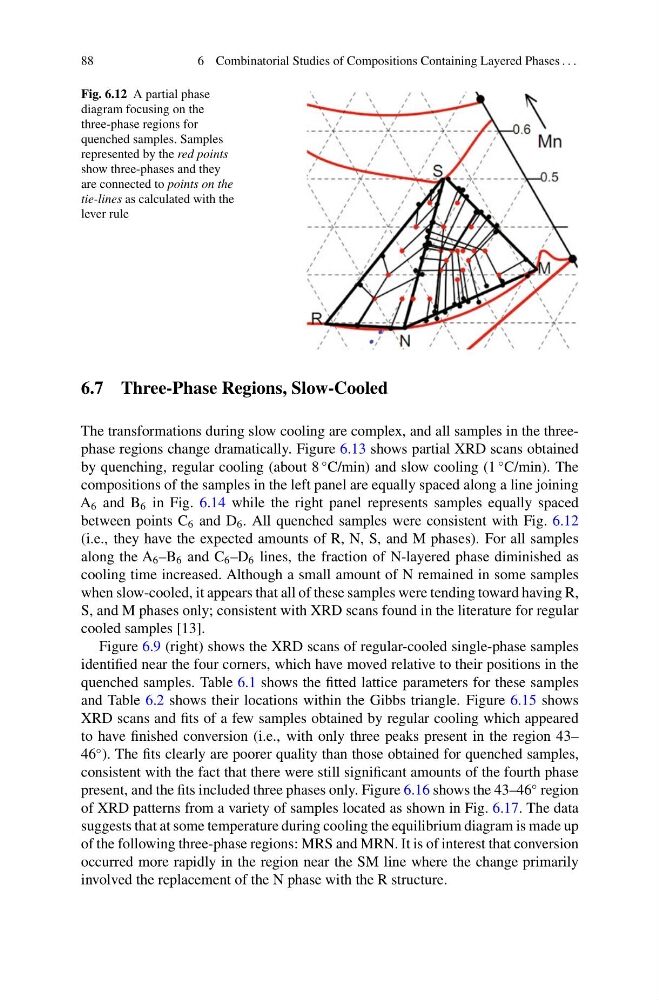
Fig. 6.12 A partial phase
diagram focusing on the
three-phase regions for
quenched samples. Samples
represented by the red points
show three-phases and they
are connected to points on the
tie-lines as calculated with the
lever rule
6.7 Three-Phase Regions, Slow-Cooled
The transformations during slow cooling are complex, and all samples in the threephase regions change dramatically. Figure 6.13 shows partial XRD scans obtained
by quenching, regular cooling (about 8
◦ C/min) and slow cooling (1
◦ C/min). The
compositions of the samples in the left panel are equally spaced along a line joining
A 6 and B 6 in Fig. 6.14 while the right panel represents samples equally spaced
between points C 6 and D 6 . All quenched samples were consistent with Fig. 6.12
(i.e., they have the expected amounts of R, N, S, and M phases). For all samples
along the A 6 –B 6 and C 6 –D 6 lines, the fraction of N-layered phase diminished as
cooling time increased. Although a small amount of N remained in some samples
when slow-cooled, it appears that all of these samples were tending toward having R,
S, and M phases only; consistent with XRD scans found in the literature for regular
cooled samples [13].
Figure 6.9 (right) shows the XRD scans of regular-cooled single-phase samples
identified near the four corners, which have moved relative to their positions in the
quenched samples. Table 6.1 shows the fitted lattice parameters for these samples
and Table 6.2 shows their locations within the Gibbs triangle. Figure 6.15 shows
XRD scans and fits of a few samples obtained by regular cooling which appeared
to have finished conversion (i.e., with only three peaks present in the region 43–
46
◦ ). The fits clearly are poorer quality than those obtained for quenched samples,
consistent with the fact that there were still significant amounts of the fourth phase
present, and the fits included three phases only. Figure 6.16 shows the 43–46
◦ region
of XRD patterns from a variety of samples located as shown in Fig. 6.17. The data
suggests that at some temperature during cooling the equilibrium diagram is made up
of the following three-phase regions: MRS and MRN. It is of interest that conversion
occurred more rapidly in the region near the SM line where the change primarily
involved the replacement of the N phase with the R structure.
6 Combinatorial Studies of Compositions Containing Layered Phases . . .
Fig. 6.12 A partial phase
diagram focusing on the
three-phase regions for
quenched samples. Samples
represented by the red points
show three-phases and they
are connected to points on the
tie-lines as calculated with the
lever rule
6.7 Three-Phase Regions, Slow-Cooled
The transformations during slow cooling are complex, and all samples in the threephase regions change dramatically. Figure 6.13 shows partial XRD scans obtained
by quenching, regular cooling (about 8
◦ C/min) and slow cooling (1
◦ C/min). The
compositions of the samples in the left panel are equally spaced along a line joining
A 6 and B 6 in Fig. 6.14 while the right panel represents samples equally spaced
between points C 6 and D 6 . All quenched samples were consistent with Fig. 6.12
(i.e., they have the expected amounts of R, N, S, and M phases). For all samples
along the A 6 –B 6 and C 6 –D 6 lines, the fraction of N-layered phase diminished as
cooling time increased. Although a small amount of N remained in some samples
when slow-cooled, it appears that all of these samples were tending toward having R,
S, and M phases only; consistent with XRD scans found in the literature for regular
cooled samples [13].
Figure 6.9 (right) shows the XRD scans of regular-cooled single-phase samples
identified near the four corners, which have moved relative to their positions in the
quenched samples. Table 6.1 shows the fitted lattice parameters for these samples
and Table 6.2 shows their locations within the Gibbs triangle. Figure 6.15 shows
XRD scans and fits of a few samples obtained by regular cooling which appeared
to have finished conversion (i.e., with only three peaks present in the region 43–
46
◦ ). The fits clearly are poorer quality than those obtained for quenched samples,
consistent with the fact that there were still significant amounts of the fourth phase
present, and the fits included three phases only. Figure 6.16 shows the 43–46
◦ region
of XRD patterns from a variety of samples located as shown in Fig. 6.17. The data
suggests that at some temperature during cooling the equilibrium diagram is made up
of the following three-phase regions: MRS and MRN. It is of interest that conversion
occurred more rapidly in the region near the SM line where the change primarily
involved the replacement of the N phase with the R structure.