

6.6 Three-Phase Regions, Quenched
87
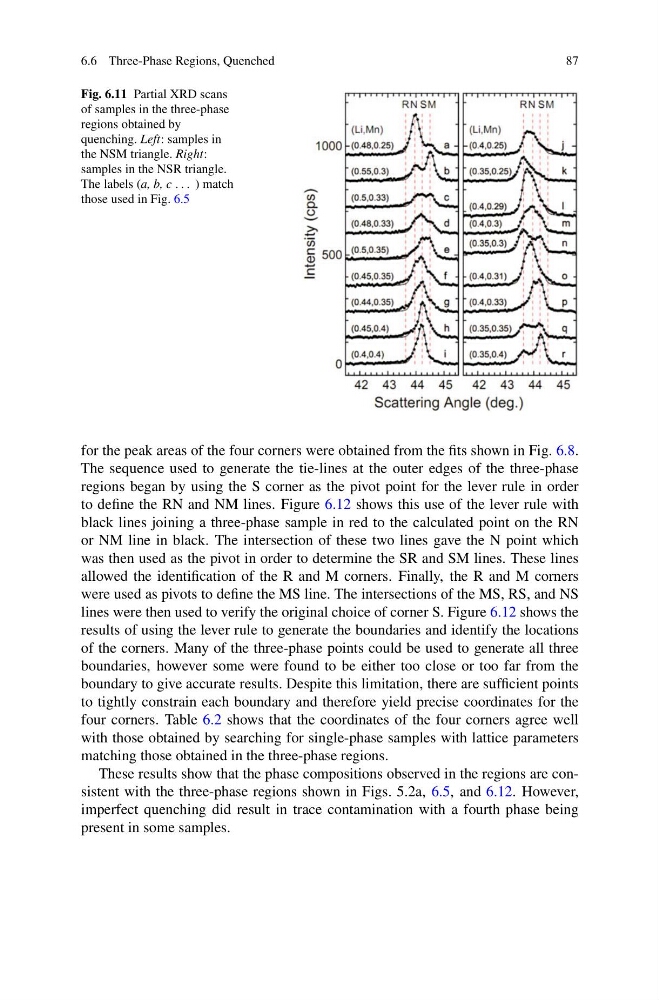
Fig. 6.11 Partial XRD scans
of samples in the three-phase
regions obtained by
quenching. Left: samples in
the NSM triangle. Right:
samples in the NSR triangle.
The labels (a, b, c . . . ) match
those used in Fig. 6.5
for the peak areas of the four corners were obtained from the fits shown in Fig. 6.8.
The sequence used to generate the tie-lines at the outer edges of the three-phase
regions began by using the S corner as the pivot point for the lever rule in order
to define the RN and NM lines. Figure 6.12 shows this use of the lever rule with
black lines joining a three-phase sample in red to the calculated point on the RN
or NM line in black. The intersection of these two lines gave the N point which
was then used as the pivot in order to determine the SR and SM lines. These lines
allowed the identification of the R and M corners. Finally, the R and M corners
were used as pivots to define the MS line. The intersections of the MS, RS, and NS
lines were then used to verify the original choice of corner S. Figure 6.12 shows the
results of using the lever rule to generate the boundaries and identify the locations
of the corners. Many of the three-phase points could be used to generate all three
boundaries, however some were found to be either too close or too far from the
boundary to give accurate results. Despite this limitation, there are sufficient points
to tightly constrain each boundary and therefore yield precise coordinates for the
four corners. Table 6.2 shows that the coordinates of the four corners agree well
with those obtained by searching for single-phase samples with lattice parameters
matching those obtained in the three-phase regions.
These results show that the phase compositions observed in the regions are consistent with the three-phase regions shown in Figs. 5.2a, 6.5, and 6.12. However,
imperfect quenching did result in trace contamination with a fourth phase being
present in some samples.
87
Fig. 6.11 Partial XRD scans
of samples in the three-phase
regions obtained by
quenching. Left: samples in
the NSM triangle. Right:
samples in the NSR triangle.
The labels (a, b, c . . . ) match
those used in Fig. 6.5
for the peak areas of the four corners were obtained from the fits shown in Fig. 6.8.
The sequence used to generate the tie-lines at the outer edges of the three-phase
regions began by using the S corner as the pivot point for the lever rule in order
to define the RN and NM lines. Figure 6.12 shows this use of the lever rule with
black lines joining a three-phase sample in red to the calculated point on the RN
or NM line in black. The intersection of these two lines gave the N point which
was then used as the pivot in order to determine the SR and SM lines. These lines
allowed the identification of the R and M corners. Finally, the R and M corners
were used as pivots to define the MS line. The intersections of the MS, RS, and NS
lines were then used to verify the original choice of corner S. Figure 6.12 shows the
results of using the lever rule to generate the boundaries and identify the locations
of the corners. Many of the three-phase points could be used to generate all three
boundaries, however some were found to be either too close or too far from the
boundary to give accurate results. Despite this limitation, there are sufficient points
to tightly constrain each boundary and therefore yield precise coordinates for the
four corners. Table 6.2 shows that the coordinates of the four corners agree well
with those obtained by searching for single-phase samples with lattice parameters
matching those obtained in the three-phase regions.
These results show that the phase compositions observed in the regions are consistent with the three-phase regions shown in Figs. 5.2a, 6.5, and 6.12. However,
imperfect quenching did result in trace contamination with a fourth phase being
present in some samples.