

86
6 Combinatorial Studies of Compositions Containing Layered Phases . . .
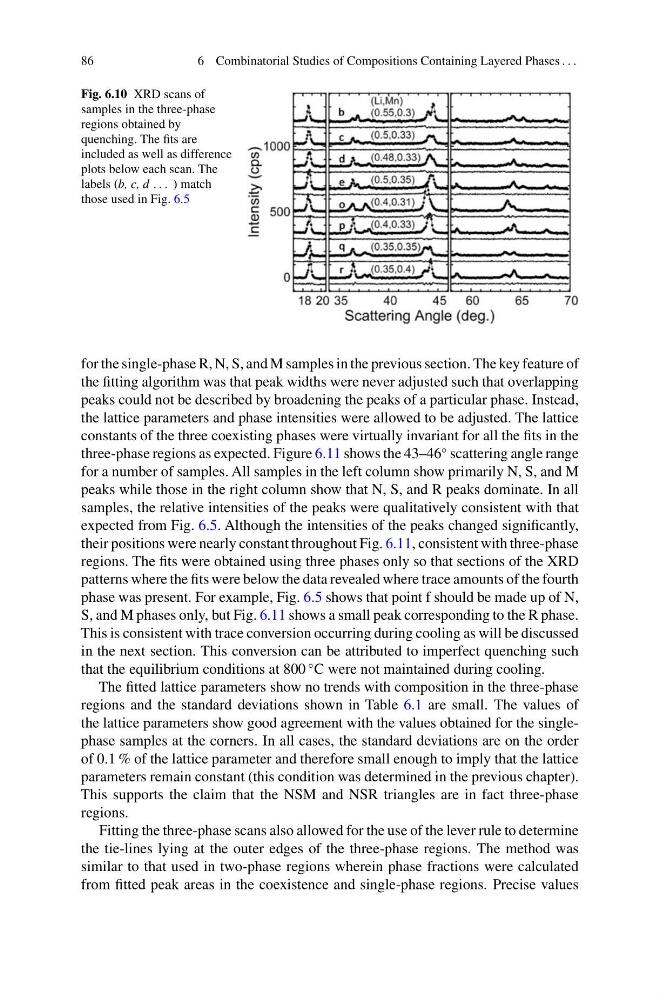
Fig. 6.10 XRD scans of
samples in the three-phase
regions obtained by
quenching. The fits are
included as well as difference
plots below each scan. The
labels (b, c, d . . . ) match
those used in Fig. 6.5
for the single-phase R, N, S, and M samples in the previous section. The key feature of
the fitting algorithm was that peak widths were never adjusted such that overlapping
peaks could not be described by broadening the peaks of a particular phase. Instead,
the lattice parameters and phase intensities were allowed to be adjusted. The lattice
constants of the three coexisting phases were virtually invariant for all the fits in the
three-phase regions as expected. Figure 6.11 shows the 43–46
◦ scattering angle range
for a number of samples. All samples in the left column show primarily N, S, and M
peaks while those in the right column show that N, S, and R peaks dominate. In all
samples, the relative intensities of the peaks were qualitatively consistent with that
expected from Fig. 6.5. Although the intensities of the peaks changed significantly,
their positions were nearly constant throughout Fig. 6.11, consistent with three-phase
regions. The fits were obtained using three phases only so that sections of the XRD
patterns where the fits were below the data revealed where trace amounts of the fourth
phase was present. For example, Fig. 6.5 shows that point f should be made up of N,
S, and M phases only, but Fig. 6.11 shows a small peak corresponding to the R phase.
This is consistent with trace conversion occurring during cooling as will be discussed
in the next section. This conversion can be attributed to imperfect quenching such
that the equilibrium conditions at 800
◦ C were not maintained during cooling.
The fitted lattice parameters show no trends with composition in the three-phase
regions and the standard deviations shown in Table 6.1 are small. The values of
the lattice parameters show good agreement with the values obtained for the singlephase samples at the corners. In all cases, the standard deviations are on the order
of 0.1 % of the lattice parameter and therefore small enough to imply that the lattice
parameters remain constant (this condition was determined in the previous chapter).
This supports the claim that the NSM and NSR triangles are in fact three-phase
regions.
Fitting the three-phase scans also allowed for the use of the lever rule to determine
the tie-lines lying at the outer edges of the three-phase regions. The method was
similar to that used in two-phase regions wherein phase fractions were calculated
from fitted peak areas in the coexistence and single-phase regions. Precise values
6 Combinatorial Studies of Compositions Containing Layered Phases . . .
Fig. 6.10 XRD scans of
samples in the three-phase
regions obtained by
quenching. The fits are
included as well as difference
plots below each scan. The
labels (b, c, d . . . ) match
those used in Fig. 6.5
for the single-phase R, N, S, and M samples in the previous section. The key feature of
the fitting algorithm was that peak widths were never adjusted such that overlapping
peaks could not be described by broadening the peaks of a particular phase. Instead,
the lattice parameters and phase intensities were allowed to be adjusted. The lattice
constants of the three coexisting phases were virtually invariant for all the fits in the
three-phase regions as expected. Figure 6.11 shows the 43–46
◦ scattering angle range
for a number of samples. All samples in the left column show primarily N, S, and M
peaks while those in the right column show that N, S, and R peaks dominate. In all
samples, the relative intensities of the peaks were qualitatively consistent with that
expected from Fig. 6.5. Although the intensities of the peaks changed significantly,
their positions were nearly constant throughout Fig. 6.11, consistent with three-phase
regions. The fits were obtained using three phases only so that sections of the XRD
patterns where the fits were below the data revealed where trace amounts of the fourth
phase was present. For example, Fig. 6.5 shows that point f should be made up of N,
S, and M phases only, but Fig. 6.11 shows a small peak corresponding to the R phase.
This is consistent with trace conversion occurring during cooling as will be discussed
in the next section. This conversion can be attributed to imperfect quenching such
that the equilibrium conditions at 800
◦ C were not maintained during cooling.
The fitted lattice parameters show no trends with composition in the three-phase
regions and the standard deviations shown in Table 6.1 are small. The values of
the lattice parameters show good agreement with the values obtained for the singlephase samples at the corners. In all cases, the standard deviations are on the order
of 0.1 % of the lattice parameter and therefore small enough to imply that the lattice
parameters remain constant (this condition was determined in the previous chapter).
This supports the claim that the NSM and NSR triangles are in fact three-phase
regions.
Fitting the three-phase scans also allowed for the use of the lever rule to determine
the tie-lines lying at the outer edges of the three-phase regions. The method was
similar to that used in two-phase regions wherein phase fractions were calculated
from fitted peak areas in the coexistence and single-phase regions. Precise values