

3 Ultrafast Dynamics of Hydrogen Atoms in Hydrocarbon Molecules
55
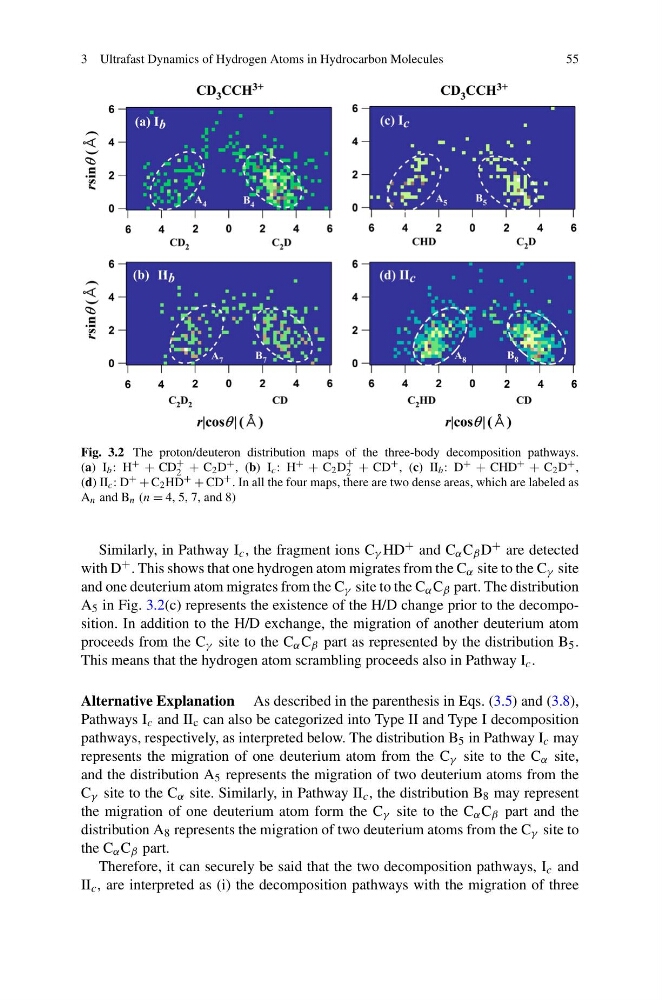
Fig. 3.2 The proton/deuteron distribution maps of the three-body decomposition pathways.
(a) I b : H + + CD
+
2 + C 2 D + , (b) I c : H + + C 2 D
+
2 + CD
+ , (c) II b : D + + CHD
+ + C 2 D + ,
(d) II c : D + + C 2 HD + + CD
+ . In all the four maps, there are two dense areas, which are labeled as
A n and B n (n = 4, 5, 7, and 8)
Similarly, in Pathway I c , the fragment ions C γ HD + and C α C β D + are detected
with D + . This shows that one hydrogen atom migrates from the C α site to the C γ site
and one deuterium atom migrates from the C γ site to the C α C β part. The distribution
A 5 in Fig. 3.2(c) represents the existence of the H/D change prior to the decomposition. In addition to the H/D exchange, the migration of another deuterium atom
proceeds from the C γ site to the C α C β part as represented by the distribution B 5 .
This means that the hydrogen atom scrambling proceeds also in Pathway I c .
Alternative Explanation As described in the parenthesis in Eqs. (3.5) and (3.8),
Pathways I c and II c can also be categorized into Type II and Type I decomposition
pathways, respectively, as interpreted below. The distribution B 5 in Pathway I c may
represents the migration of one deuterium atom from the C γ site to the C α site,
and the distribution A 5 represents the migration of two deuterium atoms from the
C γ site to the C α site. Similarly, in Pathway II c , the distribution B 8 may represent
the migration of one deuterium atom form the C γ site to the C α C β part and the
distribution A 8 represents the migration of two deuterium atoms from the C γ site to
the C α C β part.
Therefore, it can securely be said that the two decomposition pathways, I c and
II c , are interpreted as (i) the decomposition pathways with the migration of three
55
Fig. 3.2 The proton/deuteron distribution maps of the three-body decomposition pathways.
(a) I b : H + + CD
+
2 + C 2 D + , (b) I c : H + + C 2 D
+
2 + CD
+ , (c) II b : D + + CHD
+ + C 2 D + ,
(d) II c : D + + C 2 HD + + CD
+ . In all the four maps, there are two dense areas, which are labeled as
A n and B n (n = 4, 5, 7, and 8)
Similarly, in Pathway I c , the fragment ions C γ HD + and C α C β D + are detected
with D + . This shows that one hydrogen atom migrates from the C α site to the C γ site
and one deuterium atom migrates from the C γ site to the C α C β part. The distribution
A 5 in Fig. 3.2(c) represents the existence of the H/D change prior to the decomposition. In addition to the H/D exchange, the migration of another deuterium atom
proceeds from the C γ site to the C α C β part as represented by the distribution B 5 .
This means that the hydrogen atom scrambling proceeds also in Pathway I c .
Alternative Explanation As described in the parenthesis in Eqs. (3.5) and (3.8),
Pathways I c and II c can also be categorized into Type II and Type I decomposition
pathways, respectively, as interpreted below. The distribution B 5 in Pathway I c may
represents the migration of one deuterium atom from the C γ site to the C α site,
and the distribution A 5 represents the migration of two deuterium atoms from the
C γ site to the C α site. Similarly, in Pathway II c , the distribution B 8 may represent
the migration of one deuterium atom form the C γ site to the C α C β part and the
distribution A 8 represents the migration of two deuterium atoms from the C γ site to
the C α C β part.
Therefore, it can securely be said that the two decomposition pathways, I c and
II c , are interpreted as (i) the decomposition pathways with the migration of three