

11 Optical Diagnostics with Ultrafast and Strong Field Raman Techniques
273
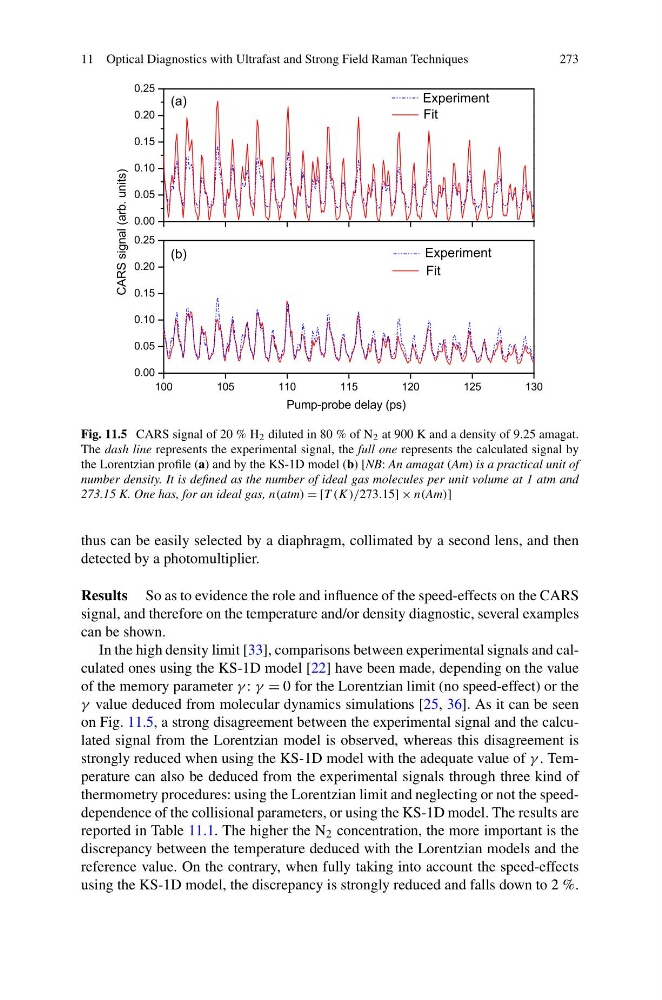
Fig. 11.5 CARS signal of 20 % H 2 diluted in 80 % of N 2 at 900 K and a density of 9.25 amagat.
The dash line represents the experimental signal, the full one represents the calculated signal by
the Lorentzian profile (a) and by the KS-1D model (b) [NB: An amagat (Am) is a practical unit of
number density. It is defined as the number of ideal gas molecules per unit volume at 1 atm and
273.15 K. One has, for an ideal gas, n(atm) = [T (K)/273.15] × n(Am)]
thus can be easily selected by a diaphragm, collimated by a second lens, and then
detected by a photomultiplier.
Results So as to evidence the role and influence of the speed-effects on the CARS
signal, and therefore on the temperature and/or density diagnostic, several examples
can be shown.
In the high density limit [33], comparisons between experimental signals and calculated ones using the KS-1D model [22] have been made, depending on the value
of the memory parameter γ : γ = 0 for the Lorentzian limit (no speed-effect) or the
γ value deduced from molecular dynamics simulations [25, 36]. As it can be seen
on Fig. 11.5, a strong disagreement between the experimental signal and the calculated signal from the Lorentzian model is observed, whereas this disagreement is
strongly reduced when using the KS-1D model with the adequate value of γ . Temperature can also be deduced from the experimental signals through three kind of
thermometry procedures: using the Lorentzian limit and neglecting or not the speeddependence of the collisional parameters, or using the KS-1D model. The results are
reported in Table 11.1. The higher the N 2 concentration, the more important is the
discrepancy between the temperature deduced with the Lorentzian models and the
reference value. On the contrary, when fully taking into account the speed-effects
using the KS-1D model, the discrepancy is strongly reduced and falls down to 2 %.
273
Fig. 11.5 CARS signal of 20 % H 2 diluted in 80 % of N 2 at 900 K and a density of 9.25 amagat.
The dash line represents the experimental signal, the full one represents the calculated signal by
the Lorentzian profile (a) and by the KS-1D model (b) [NB: An amagat (Am) is a practical unit of
number density. It is defined as the number of ideal gas molecules per unit volume at 1 atm and
273.15 K. One has, for an ideal gas, n(atm) = [T (K)/273.15] × n(Am)]
thus can be easily selected by a diaphragm, collimated by a second lens, and then
detected by a photomultiplier.
Results So as to evidence the role and influence of the speed-effects on the CARS
signal, and therefore on the temperature and/or density diagnostic, several examples
can be shown.
In the high density limit [33], comparisons between experimental signals and calculated ones using the KS-1D model [22] have been made, depending on the value
of the memory parameter γ : γ = 0 for the Lorentzian limit (no speed-effect) or the
γ value deduced from molecular dynamics simulations [25, 36]. As it can be seen
on Fig. 11.5, a strong disagreement between the experimental signal and the calculated signal from the Lorentzian model is observed, whereas this disagreement is
strongly reduced when using the KS-1D model with the adequate value of γ . Temperature can also be deduced from the experimental signals through three kind of
thermometry procedures: using the Lorentzian limit and neglecting or not the speeddependence of the collisional parameters, or using the KS-1D model. The results are
reported in Table 11.1. The higher the N 2 concentration, the more important is the
discrepancy between the temperature deduced with the Lorentzian models and the
reference value. On the contrary, when fully taking into account the speed-effects
using the KS-1D model, the discrepancy is strongly reduced and falls down to 2 %.