

268
F. Chaussard et al.
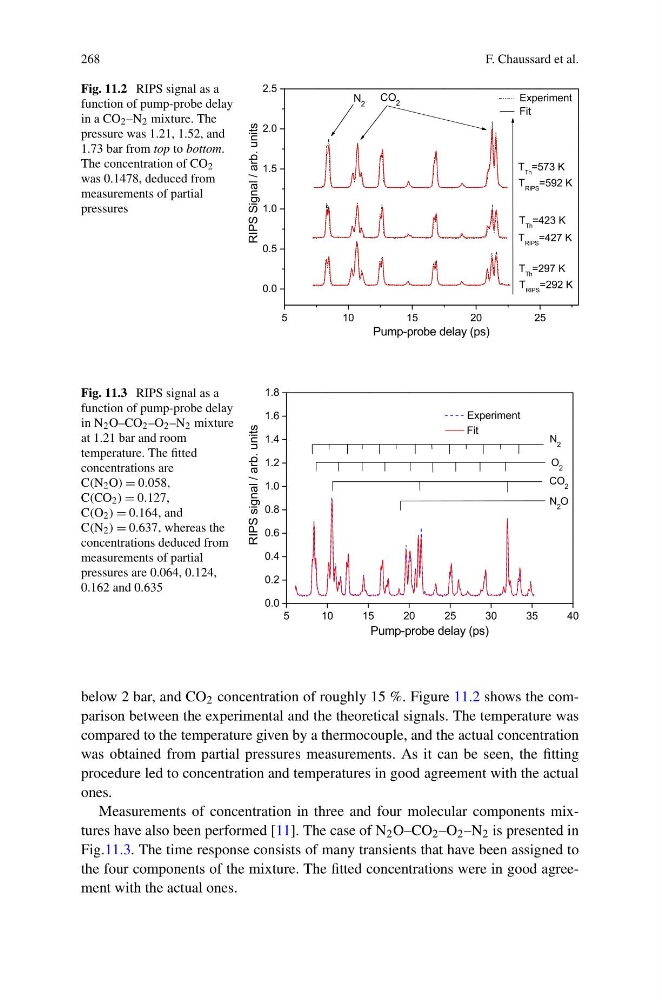
Fig. 11.2 RIPS signal as a
function of pump-probe delay
in a CO 2 –N 2 mixture. The
pressure was 1.21, 1.52, and
1.73 bar from top to bottom.
The concentration of CO 2
was 0.1478, deduced from
measurements of partial
pressures
Fig. 11.3 RIPS signal as a
function of pump-probe delay
in N 2 O–CO 2 –O 2 –N 2 mixture
at 1.21 bar and room
temperature. The fitted
concentrations are
C(N 2 O) = 0.058,
C(CO 2 ) = 0.127,
C(O 2 ) = 0.164, and
C(N 2 ) = 0.637, whereas the
concentrations deduced from
measurements of partial
pressures are 0.064, 0.124,
0.162 and 0.635
below 2 bar, and CO 2 concentration of roughly 15 %. Figure 11.2 shows the comparison between the experimental and the theoretical signals. The temperature was
compared to the temperature given by a thermocouple, and the actual concentration
was obtained from partial pressures measurements. As it can be seen, the fitting
procedure led to concentration and temperatures in good agreement with the actual
ones.
Measurements of concentration in three and four molecular components mixtures have also been performed [11]. The case of N 2 O–CO 2 –O 2 –N 2 is presented in
Fig.11.3. The time response consists of many transients that have been assigned to
the four components of the mixture. The fitted concentrations were in good agreement with the actual ones.
F. Chaussard et al.
Fig. 11.2 RIPS signal as a
function of pump-probe delay
in a CO 2 –N 2 mixture. The
pressure was 1.21, 1.52, and
1.73 bar from top to bottom.
The concentration of CO 2
was 0.1478, deduced from
measurements of partial
pressures
Fig. 11.3 RIPS signal as a
function of pump-probe delay
in N 2 O–CO 2 –O 2 –N 2 mixture
at 1.21 bar and room
temperature. The fitted
concentrations are
C(N 2 O) = 0.058,
C(CO 2 ) = 0.127,
C(O 2 ) = 0.164, and
C(N 2 ) = 0.637, whereas the
concentrations deduced from
measurements of partial
pressures are 0.064, 0.124,
0.162 and 0.635
below 2 bar, and CO 2 concentration of roughly 15 %. Figure 11.2 shows the comparison between the experimental and the theoretical signals. The temperature was
compared to the temperature given by a thermocouple, and the actual concentration
was obtained from partial pressures measurements. As it can be seen, the fitting
procedure led to concentration and temperatures in good agreement with the actual
ones.
Measurements of concentration in three and four molecular components mixtures have also been performed [11]. The case of N 2 O–CO 2 –O 2 –N 2 is presented in
Fig.11.3. The time response consists of many transients that have been assigned to
the four components of the mixture. The fitted concentrations were in good agreement with the actual ones.