

10 Surface-Aligned Femtochemistry: Dynamics on Oxide Surfaces
243
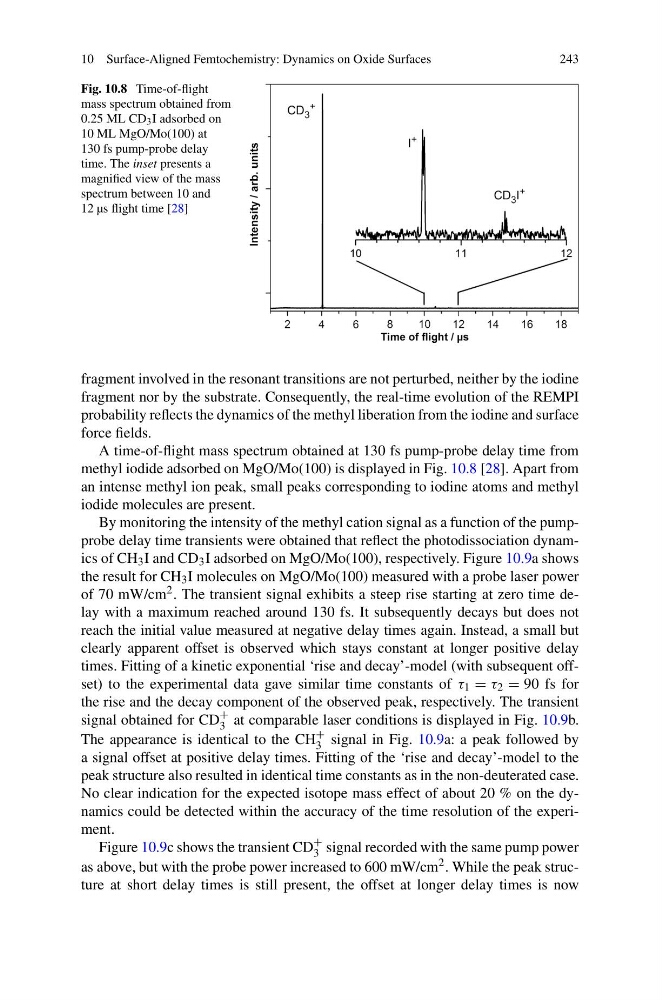
Fig. 10.8 Time-of-flight
mass spectrum obtained from
0.25 ML CD 3 I adsorbed on
10 ML MgO/Mo(100) at
130 fs pump-probe delay
time. The inset presents a
magnified view of the mass
spectrum between 10 and
12 µs flight time [28]
fragment involved in the resonant transitions are not perturbed, neither by the iodine
fragment nor by the substrate. Consequently, the real-time evolution of the REMPI
probability reflects the dynamics of the methyl liberation from the iodine and surface
force fields.
A time-of-flight mass spectrum obtained at 130 fs pump-probe delay time from
methyl iodide adsorbed on MgO/Mo(100) is displayed in Fig. 10.8 [28]. Apart from
an intense methyl ion peak, small peaks corresponding to iodine atoms and methyl
iodide molecules are present.
By monitoring the intensity of the methyl cation signal as a function of the pumpprobe delay time transients were obtained that reflect the photodissociation dynamics of CH 3 I and CD 3 I adsorbed on MgO/Mo(100), respectively. Figure 10.9a shows
the result for CH 3 I molecules on MgO/Mo(100) measured with a probe laser power
of 70 mW/cm 2 . The transient signal exhibits a steep rise starting at zero time delay with a maximum reached around 130 fs. It subsequently decays but does not
reach the initial value measured at negative delay times again. Instead, a small but
clearly apparent offset is observed which stays constant at longer positive delay
times. Fitting of a kinetic exponential ‘rise and decay’-model (with subsequent offset) to the experimental data gave similar time constants of τ 1 = τ 2 = 90 fs for
the rise and the decay component of the observed peak, respectively. The transient
signal obtained for CD
+
3 at comparable laser conditions is displayed in Fig. 10.9b.
The appearance is identical to the CH
+
3 signal in Fig. 10.9a: a peak followed by
a signal offset at positive delay times. Fitting of the ‘rise and decay’-model to the
peak structure also resulted in identical time constants as in the non-deuterated case.
No clear indication for the expected isotope mass effect of about 20 % on the dynamics could be detected within the accuracy of the time resolution of the experiment.
Figure 10.9c shows the transient CD
+
3 signal recorded with the same pump power
as above, but with the probe power increased to 600 mW/cm 2 . While the peak structure at short delay times is still present, the offset at longer delay times is now
243
Fig. 10.8 Time-of-flight
mass spectrum obtained from
0.25 ML CD 3 I adsorbed on
10 ML MgO/Mo(100) at
130 fs pump-probe delay
time. The inset presents a
magnified view of the mass
spectrum between 10 and
12 µs flight time [28]
fragment involved in the resonant transitions are not perturbed, neither by the iodine
fragment nor by the substrate. Consequently, the real-time evolution of the REMPI
probability reflects the dynamics of the methyl liberation from the iodine and surface
force fields.
A time-of-flight mass spectrum obtained at 130 fs pump-probe delay time from
methyl iodide adsorbed on MgO/Mo(100) is displayed in Fig. 10.8 [28]. Apart from
an intense methyl ion peak, small peaks corresponding to iodine atoms and methyl
iodide molecules are present.
By monitoring the intensity of the methyl cation signal as a function of the pumpprobe delay time transients were obtained that reflect the photodissociation dynamics of CH 3 I and CD 3 I adsorbed on MgO/Mo(100), respectively. Figure 10.9a shows
the result for CH 3 I molecules on MgO/Mo(100) measured with a probe laser power
of 70 mW/cm 2 . The transient signal exhibits a steep rise starting at zero time delay with a maximum reached around 130 fs. It subsequently decays but does not
reach the initial value measured at negative delay times again. Instead, a small but
clearly apparent offset is observed which stays constant at longer positive delay
times. Fitting of a kinetic exponential ‘rise and decay’-model (with subsequent offset) to the experimental data gave similar time constants of τ 1 = τ 2 = 90 fs for
the rise and the decay component of the observed peak, respectively. The transient
signal obtained for CD
+
3 at comparable laser conditions is displayed in Fig. 10.9b.
The appearance is identical to the CH
+
3 signal in Fig. 10.9a: a peak followed by
a signal offset at positive delay times. Fitting of the ‘rise and decay’-model to the
peak structure also resulted in identical time constants as in the non-deuterated case.
No clear indication for the expected isotope mass effect of about 20 % on the dynamics could be detected within the accuracy of the time resolution of the experiment.
Figure 10.9c shows the transient CD
+
3 signal recorded with the same pump power
as above, but with the probe power increased to 600 mW/cm 2 . While the peak structure at short delay times is still present, the offset at longer delay times is now