

244
M.E. Vaida and T.M. Bernhardt
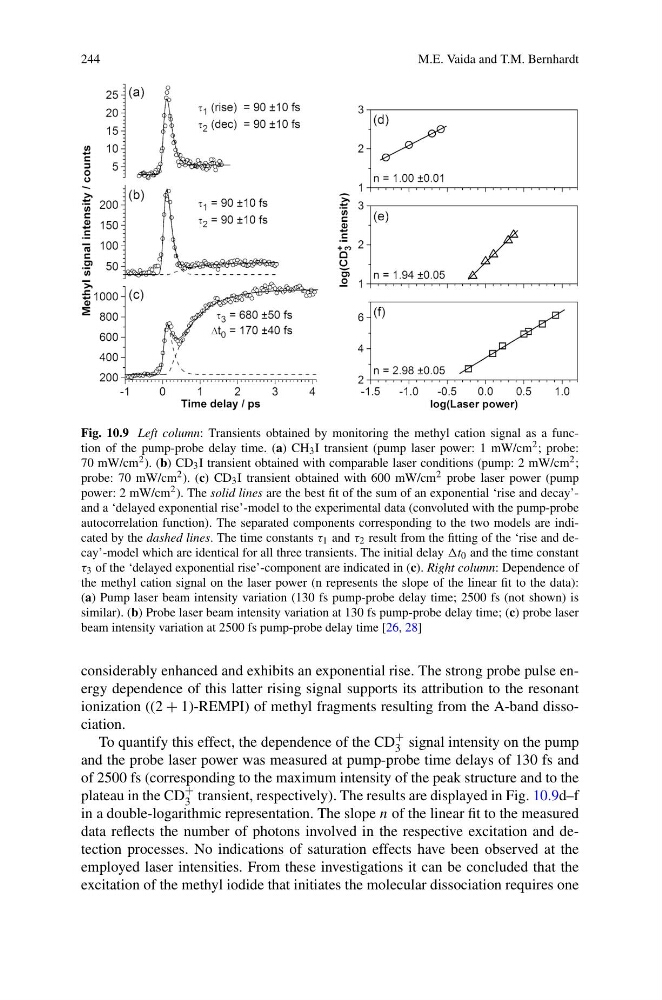
Fig. 10.9 Left column: Transients obtained by monitoring the methyl cation signal as a function of the pump-probe delay time. (a) CH 3 I transient (pump laser power: 1 mW/cm 2 ; probe:
70 mW/cm 2 ). (b) CD 3 I transient obtained with comparable laser conditions (pump: 2 mW/cm 2 ;
probe: 70 mW/cm 2 ). (c) CD 3 I transient obtained with 600 mW/cm 2 probe laser power (pump
power: 2 mW/cm 2 ). The solid lines are the best fit of the sum of an exponential ‘rise and decay’and a ‘delayed exponential rise’-model to the experimental data (convoluted with the pump-probe
autocorrelation function). The separated components corresponding to the two models are indicated by the dashed lines. The time constants τ 1 and τ 2 result from the fitting of the ‘rise and decay’-model which are identical for all three transients. The initial delay t 0 and the time constant
τ 3 of the ‘delayed exponential rise’-component are indicated in (c). Right column: Dependence of
the methyl cation signal on the laser power (n represents the slope of the linear fit to the data):
(a) Pump laser beam intensity variation (130 fs pump-probe delay time; 2500 fs (not shown) is
similar). (b) Probe laser beam intensity variation at 130 fs pump-probe delay time; (c) probe laser
beam intensity variation at 2500 fs pump-probe delay time [26, 28]
considerably enhanced and exhibits an exponential rise. The strong probe pulse energy dependence of this latter rising signal supports its attribution to the resonant
ionization ((2 + 1)-REMPI) of methyl fragments resulting from the A-band dissociation.
To quantify this effect, the dependence of the CD
+
3 signal intensity on the pump
and the probe laser power was measured at pump-probe time delays of 130 fs and
of 2500 fs (corresponding to the maximum intensity of the peak structure and to the
plateau in the CD
+
3 transient, respectively). The results are displayed in Fig. 10.9d–f
in a double-logarithmic representation. The slope n of the linear fit to the measured
data reflects the number of photons involved in the respective excitation and detection processes. No indications of saturation effects have been observed at the
employed laser intensities. From these investigations it can be concluded that the
excitation of the methyl iodide that initiates the molecular dissociation requires one
M.E. Vaida and T.M. Bernhardt
Fig. 10.9 Left column: Transients obtained by monitoring the methyl cation signal as a function of the pump-probe delay time. (a) CH 3 I transient (pump laser power: 1 mW/cm 2 ; probe:
70 mW/cm 2 ). (b) CD 3 I transient obtained with comparable laser conditions (pump: 2 mW/cm 2 ;
probe: 70 mW/cm 2 ). (c) CD 3 I transient obtained with 600 mW/cm 2 probe laser power (pump
power: 2 mW/cm 2 ). The solid lines are the best fit of the sum of an exponential ‘rise and decay’and a ‘delayed exponential rise’-model to the experimental data (convoluted with the pump-probe
autocorrelation function). The separated components corresponding to the two models are indicated by the dashed lines. The time constants τ 1 and τ 2 result from the fitting of the ‘rise and decay’-model which are identical for all three transients. The initial delay t 0 and the time constant
τ 3 of the ‘delayed exponential rise’-component are indicated in (c). Right column: Dependence of
the methyl cation signal on the laser power (n represents the slope of the linear fit to the data):
(a) Pump laser beam intensity variation (130 fs pump-probe delay time; 2500 fs (not shown) is
similar). (b) Probe laser beam intensity variation at 130 fs pump-probe delay time; (c) probe laser
beam intensity variation at 2500 fs pump-probe delay time [26, 28]
considerably enhanced and exhibits an exponential rise. The strong probe pulse energy dependence of this latter rising signal supports its attribution to the resonant
ionization ((2 + 1)-REMPI) of methyl fragments resulting from the A-band dissociation.
To quantify this effect, the dependence of the CD
+
3 signal intensity on the pump
and the probe laser power was measured at pump-probe time delays of 130 fs and
of 2500 fs (corresponding to the maximum intensity of the peak structure and to the
plateau in the CD
+
3 transient, respectively). The results are displayed in Fig. 10.9d–f
in a double-logarithmic representation. The slope n of the linear fit to the measured
data reflects the number of photons involved in the respective excitation and detection processes. No indications of saturation effects have been observed at the
employed laser intensities. From these investigations it can be concluded that the
excitation of the methyl iodide that initiates the molecular dissociation requires one