

220
T. Buckup et al.
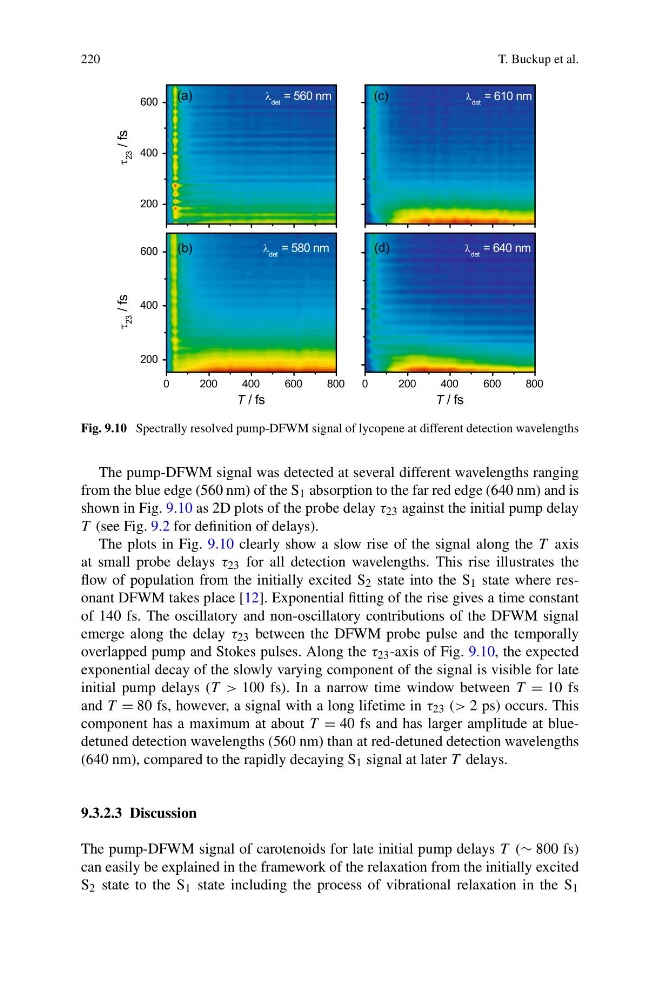
Fig. 9.10 Spectrally resolved pump-DFWM signal of lycopene at different detection wavelengths
The pump-DFWM signal was detected at several different wavelengths ranging
from the blue edge (560 nm) of the S 1 absorption to the far red edge (640 nm) and is
shown in Fig. 9.10 as 2D plots of the probe delay τ 23 against the initial pump delay
T (see Fig. 9.2 for definition of delays).
The plots in Fig. 9.10 clearly show a slow rise of the signal along the T axis
at small probe delays τ 23 for all detection wavelengths. This rise illustrates the
flow of population from the initially excited S 2 state into the S 1 state where resonant DFWM takes place [12]. Exponential fitting of the rise gives a time constant
of 140 fs. The oscillatory and non-oscillatory contributions of the DFWM signal
emerge along the delay τ 23 between the DFWM probe pulse and the temporally
overlapped pump and Stokes pulses. Along the τ 23 -axis of Fig. 9.10, the expected
exponential decay of the slowly varying component of the signal is visible for late
initial pump delays (T > 100 fs). In a narrow time window between T = 10 fs
and T = 80 fs, however, a signal with a long lifetime in τ 23 (> 2 ps) occurs. This
component has a maximum at about T = 40 fs and has larger amplitude at bluedetuned detection wavelengths (560 nm) than at red-detuned detection wavelengths
(640 nm), compared to the rapidly decaying S 1 signal at later T delays.
9.3.2.3 Discussion
The pump-DFWM signal of carotenoids for late initial pump delays T (∼ 800 fs)
can easily be explained in the framework of the relaxation from the initially excited
S 2 state to the S 1 state including the process of vibrational relaxation in the S 1
T. Buckup et al.
Fig. 9.10 Spectrally resolved pump-DFWM signal of lycopene at different detection wavelengths
The pump-DFWM signal was detected at several different wavelengths ranging
from the blue edge (560 nm) of the S 1 absorption to the far red edge (640 nm) and is
shown in Fig. 9.10 as 2D plots of the probe delay τ 23 against the initial pump delay
T (see Fig. 9.2 for definition of delays).
The plots in Fig. 9.10 clearly show a slow rise of the signal along the T axis
at small probe delays τ 23 for all detection wavelengths. This rise illustrates the
flow of population from the initially excited S 2 state into the S 1 state where resonant DFWM takes place [12]. Exponential fitting of the rise gives a time constant
of 140 fs. The oscillatory and non-oscillatory contributions of the DFWM signal
emerge along the delay τ 23 between the DFWM probe pulse and the temporally
overlapped pump and Stokes pulses. Along the τ 23 -axis of Fig. 9.10, the expected
exponential decay of the slowly varying component of the signal is visible for late
initial pump delays (T > 100 fs). In a narrow time window between T = 10 fs
and T = 80 fs, however, a signal with a long lifetime in τ 23 (> 2 ps) occurs. This
component has a maximum at about T = 40 fs and has larger amplitude at bluedetuned detection wavelengths (560 nm) than at red-detuned detection wavelengths
(640 nm), compared to the rapidly decaying S 1 signal at later T delays.
9.3.2.3 Discussion
The pump-DFWM signal of carotenoids for late initial pump delays T (∼ 800 fs)
can easily be explained in the framework of the relaxation from the initially excited
S 2 state to the S 1 state including the process of vibrational relaxation in the S 1