

9 On the Investigation of Excited State Dynamics with (Pump-)Degenerate
219
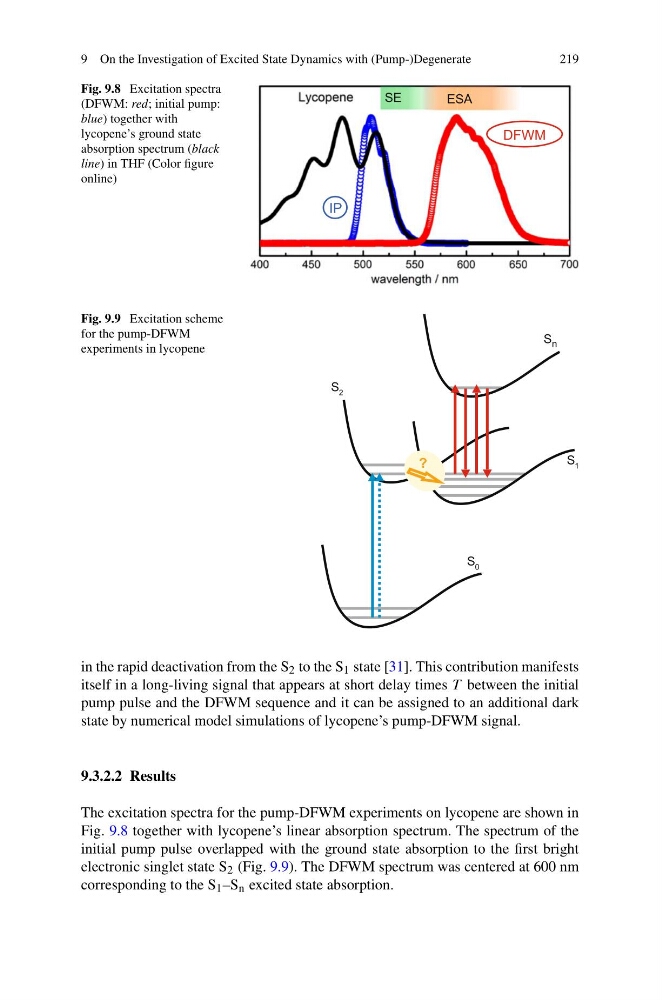
Fig. 9.8 Excitation spectra
(DFWM: red; initial pump:
blue) together with
lycopene’s ground state
absorption spectrum (black
line) in THF (Color figure
online)
Fig. 9.9 Excitation scheme
for the pump-DFWM
experiments in lycopene
in the rapid deactivation from the S 2 to the S 1 state [31]. This contribution manifests
itself in a long-living signal that appears at short delay times T between the initial
pump pulse and the DFWM sequence and it can be assigned to an additional dark
state by numerical model simulations of lycopene’s pump-DFWM signal.
9.3.2.2 Results
The excitation spectra for the pump-DFWM experiments on lycopene are shown in
Fig. 9.8 together with lycopene’s linear absorption spectrum. The spectrum of the
initial pump pulse overlapped with the ground state absorption to the first bright
electronic singlet state S 2 (Fig. 9.9). The DFWM spectrum was centered at 600 nm
corresponding to the S 1 –S n excited state absorption.
219
Fig. 9.8 Excitation spectra
(DFWM: red; initial pump:
blue) together with
lycopene’s ground state
absorption spectrum (black
line) in THF (Color figure
online)
Fig. 9.9 Excitation scheme
for the pump-DFWM
experiments in lycopene
in the rapid deactivation from the S 2 to the S 1 state [31]. This contribution manifests
itself in a long-living signal that appears at short delay times T between the initial
pump pulse and the DFWM sequence and it can be assigned to an additional dark
state by numerical model simulations of lycopene’s pump-DFWM signal.
9.3.2.2 Results
The excitation spectra for the pump-DFWM experiments on lycopene are shown in
Fig. 9.8 together with lycopene’s linear absorption spectrum. The spectrum of the
initial pump pulse overlapped with the ground state absorption to the first bright
electronic singlet state S 2 (Fig. 9.9). The DFWM spectrum was centered at 600 nm
corresponding to the S 1 –S n excited state absorption.