

214
T. Buckup et al.
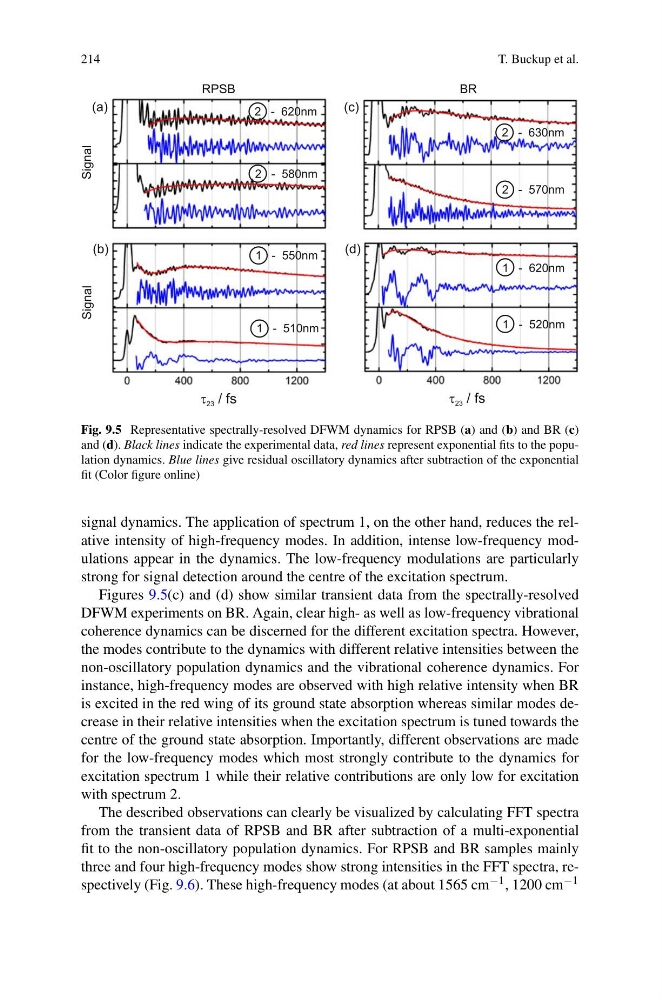
Fig. 9.5 Representative spectrally-resolved DFWM dynamics for RPSB (a) and (b) and BR (c)
and (d). Black lines indicate the experimental data, red lines represent exponential fits to the population dynamics. Blue lines give residual oscillatory dynamics after subtraction of the exponential
fit (Color figure online)
signal dynamics. The application of spectrum 1, on the other hand, reduces the relative intensity of high-frequency modes. In addition, intense low-frequency modulations appear in the dynamics. The low-frequency modulations are particularly
strong for signal detection around the centre of the excitation spectrum.
Figures 9.5(c) and (d) show similar transient data from the spectrally-resolved
DFWM experiments on BR. Again, clear high- as well as low-frequency vibrational
coherence dynamics can be discerned for the different excitation spectra. However,
the modes contribute to the dynamics with different relative intensities between the
non-oscillatory population dynamics and the vibrational coherence dynamics. For
instance, high-frequency modes are observed with high relative intensity when BR
is excited in the red wing of its ground state absorption whereas similar modes decrease in their relative intensities when the excitation spectrum is tuned towards the
centre of the ground state absorption. Importantly, different observations are made
for the low-frequency modes which most strongly contribute to the dynamics for
excitation spectrum 1 while their relative contributions are only low for excitation
with spectrum 2.
The described observations can clearly be visualized by calculating FFT spectra
from the transient data of RPSB and BR after subtraction of a multi-exponential
fit to the non-oscillatory population dynamics. For RPSB and BR samples mainly
three and four high-frequency modes show strong intensities in the FFT spectra, respectively (Fig. 9.6). These high-frequency modes (at about 1565 cm −1 , 1200 cm −1
T. Buckup et al.
Fig. 9.5 Representative spectrally-resolved DFWM dynamics for RPSB (a) and (b) and BR (c)
and (d). Black lines indicate the experimental data, red lines represent exponential fits to the population dynamics. Blue lines give residual oscillatory dynamics after subtraction of the exponential
fit (Color figure online)
signal dynamics. The application of spectrum 1, on the other hand, reduces the relative intensity of high-frequency modes. In addition, intense low-frequency modulations appear in the dynamics. The low-frequency modulations are particularly
strong for signal detection around the centre of the excitation spectrum.
Figures 9.5(c) and (d) show similar transient data from the spectrally-resolved
DFWM experiments on BR. Again, clear high- as well as low-frequency vibrational
coherence dynamics can be discerned for the different excitation spectra. However,
the modes contribute to the dynamics with different relative intensities between the
non-oscillatory population dynamics and the vibrational coherence dynamics. For
instance, high-frequency modes are observed with high relative intensity when BR
is excited in the red wing of its ground state absorption whereas similar modes decrease in their relative intensities when the excitation spectrum is tuned towards the
centre of the ground state absorption. Importantly, different observations are made
for the low-frequency modes which most strongly contribute to the dynamics for
excitation spectrum 1 while their relative contributions are only low for excitation
with spectrum 2.
The described observations can clearly be visualized by calculating FFT spectra
from the transient data of RPSB and BR after subtraction of a multi-exponential
fit to the non-oscillatory population dynamics. For RPSB and BR samples mainly
three and four high-frequency modes show strong intensities in the FFT spectra, respectively (Fig. 9.6). These high-frequency modes (at about 1565 cm −1 , 1200 cm −1