

9 On the Investigation of Excited State Dynamics with (Pump-)Degenerate
215
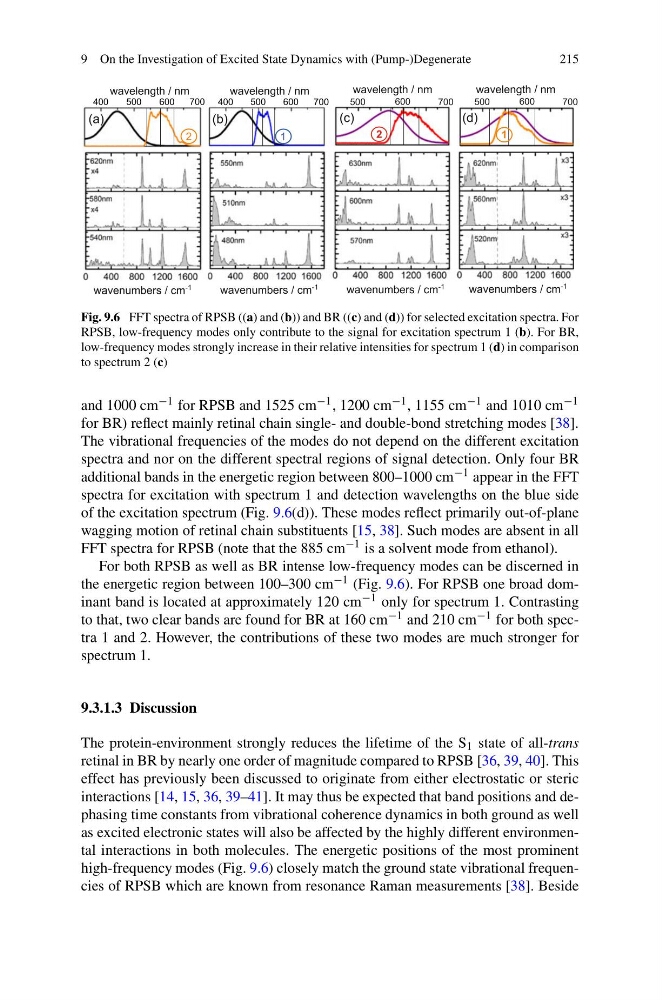
Fig. 9.6 FFT spectra of RPSB ((a) and (b)) and BR ((c) and (d)) for selected excitation spectra. For
RPSB, low-frequency modes only contribute to the signal for excitation spectrum 1 (b). For BR,
low-frequency modes strongly increase in their relative intensities for spectrum 1 (d) in comparison
to spectrum 2 (c)
and 1000 cm −1 for RPSB and 1525 cm −1 , 1200 cm −1 , 1155 cm −1 and 1010 cm −1
for BR) reflect mainly retinal chain single- and double-bond stretching modes [38].
The vibrational frequencies of the modes do not depend on the different excitation
spectra and nor on the different spectral regions of signal detection. Only four BR
additional bands in the energetic region between 800–1000 cm −1 appear in the FFT
spectra for excitation with spectrum 1 and detection wavelengths on the blue side
of the excitation spectrum (Fig. 9.6(d)). These modes reflect primarily out-of-plane
wagging motion of retinal chain substituents [15, 38]. Such modes are absent in all
FFT spectra for RPSB (note that the 885 cm −1 is a solvent mode from ethanol).
For both RPSB as well as BR intense low-frequency modes can be discerned in
the energetic region between 100–300 cm −1 (Fig. 9.6). For RPSB one broad dominant band is located at approximately 120 cm −1 only for spectrum 1. Contrasting
to that, two clear bands are found for BR at 160 cm −1 and 210 cm −1 for both spectra 1 and 2. However, the contributions of these two modes are much stronger for
spectrum 1.
9.3.1.3 Discussion
The protein-environment strongly reduces the lifetime of the S 1 state of all-trans
retinal in BR by nearly one order of magnitude compared to RPSB [36, 39, 40]. This
effect has previously been discussed to originate from either electrostatic or steric
interactions [14, 15, 36, 39–41]. It may thus be expected that band positions and dephasing time constants from vibrational coherence dynamics in both ground as well
as excited electronic states will also be affected by the highly different environmental interactions in both molecules. The energetic positions of the most prominent
high-frequency modes (Fig. 9.6) closely match the ground state vibrational frequencies of RPSB which are known from resonance Raman measurements [38]. Beside
215
Fig. 9.6 FFT spectra of RPSB ((a) and (b)) and BR ((c) and (d)) for selected excitation spectra. For
RPSB, low-frequency modes only contribute to the signal for excitation spectrum 1 (b). For BR,
low-frequency modes strongly increase in their relative intensities for spectrum 1 (d) in comparison
to spectrum 2 (c)
and 1000 cm −1 for RPSB and 1525 cm −1 , 1200 cm −1 , 1155 cm −1 and 1010 cm −1
for BR) reflect mainly retinal chain single- and double-bond stretching modes [38].
The vibrational frequencies of the modes do not depend on the different excitation
spectra and nor on the different spectral regions of signal detection. Only four BR
additional bands in the energetic region between 800–1000 cm −1 appear in the FFT
spectra for excitation with spectrum 1 and detection wavelengths on the blue side
of the excitation spectrum (Fig. 9.6(d)). These modes reflect primarily out-of-plane
wagging motion of retinal chain substituents [15, 38]. Such modes are absent in all
FFT spectra for RPSB (note that the 885 cm −1 is a solvent mode from ethanol).
For both RPSB as well as BR intense low-frequency modes can be discerned in
the energetic region between 100–300 cm −1 (Fig. 9.6). For RPSB one broad dominant band is located at approximately 120 cm −1 only for spectrum 1. Contrasting
to that, two clear bands are found for BR at 160 cm −1 and 210 cm −1 for both spectra 1 and 2. However, the contributions of these two modes are much stronger for
spectrum 1.
9.3.1.3 Discussion
The protein-environment strongly reduces the lifetime of the S 1 state of all-trans
retinal in BR by nearly one order of magnitude compared to RPSB [36, 39, 40]. This
effect has previously been discussed to originate from either electrostatic or steric
interactions [14, 15, 36, 39–41]. It may thus be expected that band positions and dephasing time constants from vibrational coherence dynamics in both ground as well
as excited electronic states will also be affected by the highly different environmental interactions in both molecules. The energetic positions of the most prominent
high-frequency modes (Fig. 9.6) closely match the ground state vibrational frequencies of RPSB which are known from resonance Raman measurements [38]. Beside