

9 On the Investigation of Excited State Dynamics with (Pump-)Degenerate
213
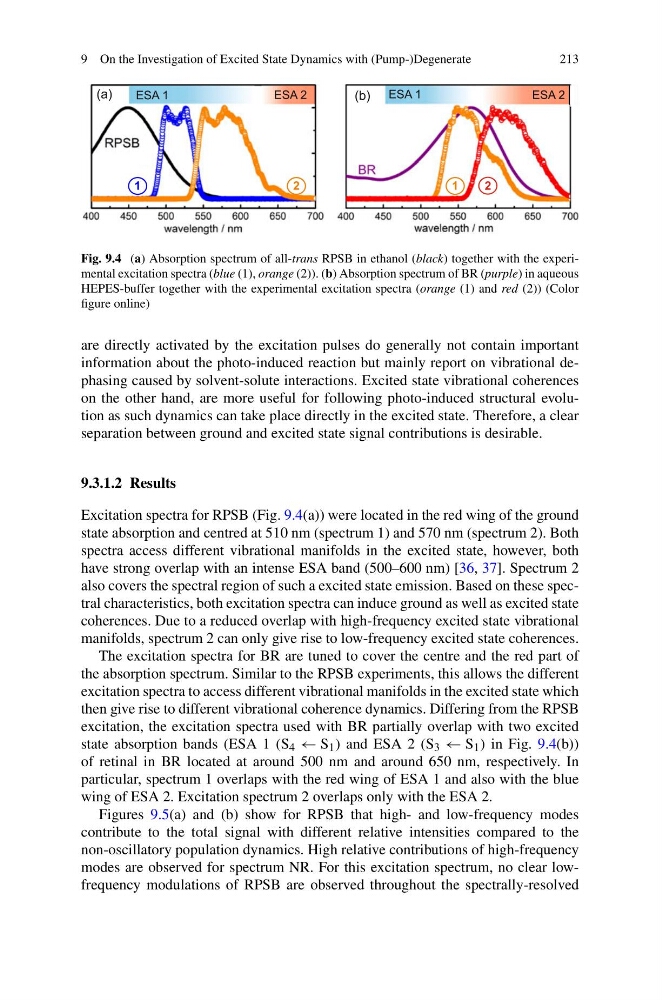
Fig. 9.4 (a) Absorption spectrum of all-trans RPSB in ethanol (black) together with the experimental excitation spectra (blue (1), orange (2)). (b) Absorption spectrum of BR (purple) in aqueous
HEPES-buffer together with the experimental excitation spectra (orange (1) and red (2)) (Color
figure online)
are directly activated by the excitation pulses do generally not contain important
information about the photo-induced reaction but mainly report on vibrational dephasing caused by solvent-solute interactions. Excited state vibrational coherences
on the other hand, are more useful for following photo-induced structural evolution as such dynamics can take place directly in the excited state. Therefore, a clear
separation between ground and excited state signal contributions is desirable.
9.3.1.2 Results
Excitation spectra for RPSB (Fig. 9.4(a)) were located in the red wing of the ground
state absorption and centred at 510 nm (spectrum 1) and 570 nm (spectrum 2). Both
spectra access different vibrational manifolds in the excited state, however, both
have strong overlap with an intense ESA band (500–600 nm) [36, 37]. Spectrum 2
also covers the spectral region of such a excited state emission. Based on these spectral characteristics, both excitation spectra can induce ground as well as excited state
coherences. Due to a reduced overlap with high-frequency excited state vibrational
manifolds, spectrum 2 can only give rise to low-frequency excited state coherences.
The excitation spectra for BR are tuned to cover the centre and the red part of
the absorption spectrum. Similar to the RPSB experiments, this allows the different
excitation spectra to access different vibrational manifolds in the excited state which
then give rise to different vibrational coherence dynamics. Differing from the RPSB
excitation, the excitation spectra used with BR partially overlap with two excited
state absorption bands (ESA 1 (S 4 ← S 1 ) and ESA 2 (S 3 ← S 1 ) in Fig. 9.4(b))
of retinal in BR located at around 500 nm and around 650 nm, respectively. In
particular, spectrum 1 overlaps with the red wing of ESA 1 and also with the blue
wing of ESA 2. Excitation spectrum 2 overlaps only with the ESA 2.
Figures 9.5(a) and (b) show for RPSB that high- and low-frequency modes
contribute to the total signal with different relative intensities compared to the
non-oscillatory population dynamics. High relative contributions of high-frequency
modes are observed for spectrum NR. For this excitation spectrum, no clear lowfrequency modulations of RPSB are observed throughout the spectrally-resolved
213
Fig. 9.4 (a) Absorption spectrum of all-trans RPSB in ethanol (black) together with the experimental excitation spectra (blue (1), orange (2)). (b) Absorption spectrum of BR (purple) in aqueous
HEPES-buffer together with the experimental excitation spectra (orange (1) and red (2)) (Color
figure online)
are directly activated by the excitation pulses do generally not contain important
information about the photo-induced reaction but mainly report on vibrational dephasing caused by solvent-solute interactions. Excited state vibrational coherences
on the other hand, are more useful for following photo-induced structural evolution as such dynamics can take place directly in the excited state. Therefore, a clear
separation between ground and excited state signal contributions is desirable.
9.3.1.2 Results
Excitation spectra for RPSB (Fig. 9.4(a)) were located in the red wing of the ground
state absorption and centred at 510 nm (spectrum 1) and 570 nm (spectrum 2). Both
spectra access different vibrational manifolds in the excited state, however, both
have strong overlap with an intense ESA band (500–600 nm) [36, 37]. Spectrum 2
also covers the spectral region of such a excited state emission. Based on these spectral characteristics, both excitation spectra can induce ground as well as excited state
coherences. Due to a reduced overlap with high-frequency excited state vibrational
manifolds, spectrum 2 can only give rise to low-frequency excited state coherences.
The excitation spectra for BR are tuned to cover the centre and the red part of
the absorption spectrum. Similar to the RPSB experiments, this allows the different
excitation spectra to access different vibrational manifolds in the excited state which
then give rise to different vibrational coherence dynamics. Differing from the RPSB
excitation, the excitation spectra used with BR partially overlap with two excited
state absorption bands (ESA 1 (S 4 ← S 1 ) and ESA 2 (S 3 ← S 1 ) in Fig. 9.4(b))
of retinal in BR located at around 500 nm and around 650 nm, respectively. In
particular, spectrum 1 overlaps with the red wing of ESA 1 and also with the blue
wing of ESA 2. Excitation spectrum 2 overlaps only with the ESA 2.
Figures 9.5(a) and (b) show for RPSB that high- and low-frequency modes
contribute to the total signal with different relative intensities compared to the
non-oscillatory population dynamics. High relative contributions of high-frequency
modes are observed for spectrum NR. For this excitation spectrum, no clear lowfrequency modulations of RPSB are observed throughout the spectrally-resolved