

7 Ultrafast Laser-Induced Processes Described by Ab Initio Molecular
161
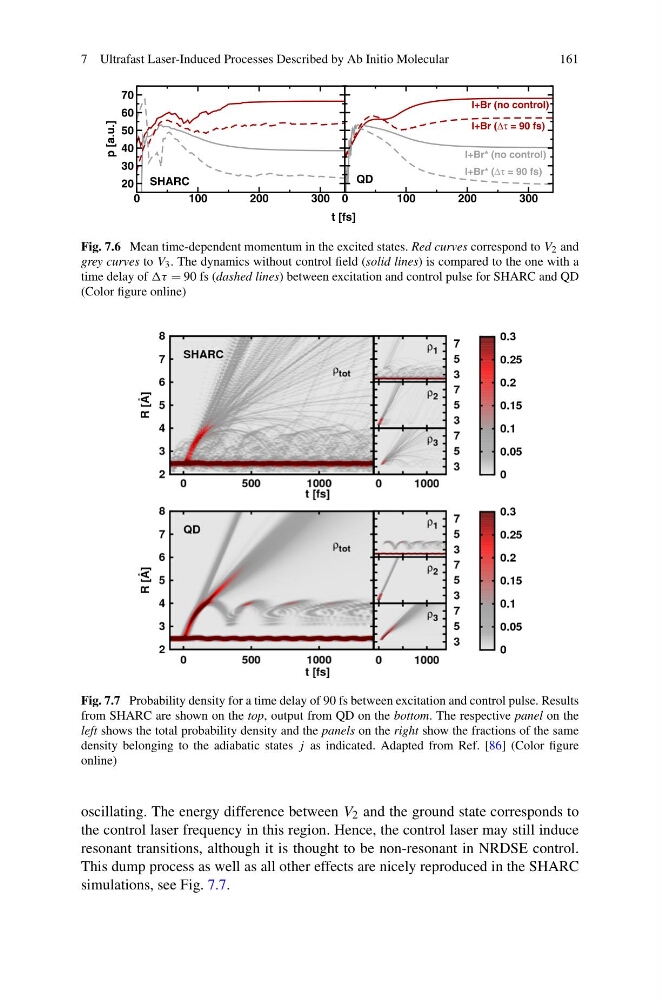
Fig. 7.6 Mean time-dependent momentum in the excited states. Red curves correspond to V 2 and
grey curves to V 3 . The dynamics without control field (solid lines) is compared to the one with a
time delay of τ = 90 fs (dashed lines) between excitation and control pulse for SHARC and QD
(Color figure online)
Fig. 7.7 Probability density for a time delay of 90 fs between excitation and control pulse. Results
from SHARC are shown on the top, output from QD on the bottom. The respective panel on the
left shows the total probability density and the panels on the right show the fractions of the same
density belonging to the adiabatic states j as indicated. Adapted from Ref. [86] (Color figure
online)
oscillating. The energy difference between V 2 and the ground state corresponds to
the control laser frequency in this region. Hence, the control laser may still induce
resonant transitions, although it is thought to be non-resonant in NRDSE control.
This dump process as well as all other effects are nicely reproduced in the SHARC
simulations, see Fig. 7.7.
161
Fig. 7.6 Mean time-dependent momentum in the excited states. Red curves correspond to V 2 and
grey curves to V 3 . The dynamics without control field (solid lines) is compared to the one with a
time delay of τ = 90 fs (dashed lines) between excitation and control pulse for SHARC and QD
(Color figure online)
Fig. 7.7 Probability density for a time delay of 90 fs between excitation and control pulse. Results
from SHARC are shown on the top, output from QD on the bottom. The respective panel on the
left shows the total probability density and the panels on the right show the fractions of the same
density belonging to the adiabatic states j as indicated. Adapted from Ref. [86] (Color figure
online)
oscillating. The energy difference between V 2 and the ground state corresponds to
the control laser frequency in this region. Hence, the control laser may still induce
resonant transitions, although it is thought to be non-resonant in NRDSE control.
This dump process as well as all other effects are nicely reproduced in the SHARC
simulations, see Fig. 7.7.