

6 Biomolecules, Photostability and 1 πσ ∗ States
137
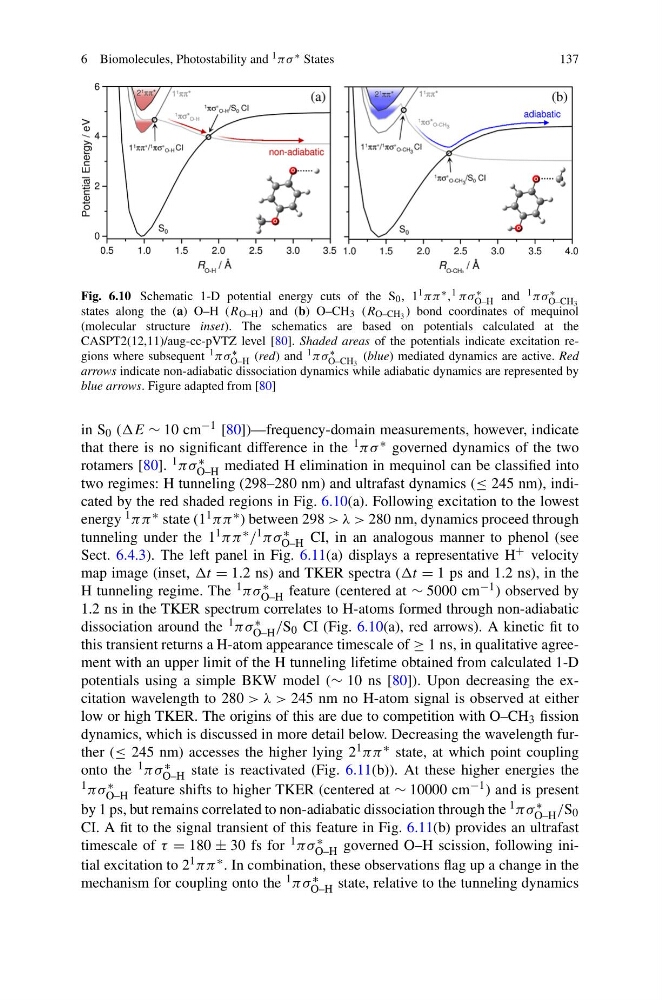
Fig. 6.10 Schematic 1-D potential energy cuts of the S 0 , 1 1 ππ ∗ , 1 πσ ∗
O–H and 1 πσ ∗
O–CH 3
states along the (a) O–H (R O–H ) and (b) O–CH 3 (R O–CH 3 ) bond coordinates of mequinol
(molecular structure inset). The schematics are based on potentials calculated at the
CASPT2(12,11)/aug-cc-pVTZ level [80]. Shaded areas of the potentials indicate excitation regions where subsequent 1 πσ ∗
O–H (red) and 1 πσ ∗
O–CH 3
(blue) mediated dynamics are active. Red
arrows indicate non-adiabatic dissociation dynamics while adiabatic dynamics are represented by
blue arrows. Figure adapted from [80]
in S 0 (E ∼ 10 cm −1 [80])—frequency-domain measurements, however, indicate
that there is no significant difference in the 1 πσ ∗ governed dynamics of the two
rotamers [80]. 1 πσ ∗
O–H mediated H elimination in mequinol can be classified into
two regimes: H tunneling (298–280 nm) and ultrafast dynamics (≤ 245 nm), indicated by the red shaded regions in Fig. 6.10(a). Following excitation to the lowest
energy 1 ππ ∗ state (1 1 ππ ∗ ) between 298 > λ > 280 nm, dynamics proceed through
tunneling under the 1 1 ππ ∗ / 1 πσ ∗
O–H CI, in an analogous manner to phenol (see
Sect. 6.4.3). The left panel in Fig. 6.11(a) displays a representative H + velocity
map image (inset, t = 1.2 ns) and TKER spectra (t = 1 ps and 1.2 ns), in the
H tunneling regime. The 1 πσ ∗
O–H feature (centered at ∼ 5000 cm −1 ) observed by
1.2 ns in the TKER spectrum correlates to H-atoms formed through non-adiabatic
dissociation around the 1 πσ ∗
O–H /S 0 CI (Fig. 6.10(a), red arrows). A kinetic fit to
this transient returns a H-atom appearance timescale of ≥ 1 ns, in qualitative agreement with an upper limit of the H tunneling lifetime obtained from calculated 1-D
potentials using a simple BKW model (∼ 10 ns [80]). Upon decreasing the excitation wavelength to 280 > λ > 245 nm no H-atom signal is observed at either
low or high TKER. The origins of this are due to competition with O–CH 3 fission
dynamics, which is discussed in more detail below. Decreasing the wavelength further (≤ 245 nm) accesses the higher lying 2 1 ππ ∗ state, at which point coupling
onto the 1 πσ ∗
O–H state is reactivated (Fig. 6.11(b)). At these higher energies the
1 πσ ∗
O–H feature shifts to higher TKER (centered at ∼ 10000 cm −1 ) and is present
by 1 ps, but remains correlated to non-adiabatic dissociation through the 1 πσ ∗
O–H /S 0
CI. A fit to the signal transient of this feature in Fig. 6.11(b) provides an ultrafast
timescale of τ = 180 ± 30 fs for 1 πσ ∗
O–H governed O–H scission, following initial excitation to 2 1 ππ ∗ . In combination, these observations flag up a change in the
mechanism for coupling onto the 1 πσ ∗
O–H state, relative to the tunneling dynamics
137
Fig. 6.10 Schematic 1-D potential energy cuts of the S 0 , 1 1 ππ ∗ , 1 πσ ∗
O–H and 1 πσ ∗
O–CH 3
states along the (a) O–H (R O–H ) and (b) O–CH 3 (R O–CH 3 ) bond coordinates of mequinol
(molecular structure inset). The schematics are based on potentials calculated at the
CASPT2(12,11)/aug-cc-pVTZ level [80]. Shaded areas of the potentials indicate excitation regions where subsequent 1 πσ ∗
O–H (red) and 1 πσ ∗
O–CH 3
(blue) mediated dynamics are active. Red
arrows indicate non-adiabatic dissociation dynamics while adiabatic dynamics are represented by
blue arrows. Figure adapted from [80]
in S 0 (E ∼ 10 cm −1 [80])—frequency-domain measurements, however, indicate
that there is no significant difference in the 1 πσ ∗ governed dynamics of the two
rotamers [80]. 1 πσ ∗
O–H mediated H elimination in mequinol can be classified into
two regimes: H tunneling (298–280 nm) and ultrafast dynamics (≤ 245 nm), indicated by the red shaded regions in Fig. 6.10(a). Following excitation to the lowest
energy 1 ππ ∗ state (1 1 ππ ∗ ) between 298 > λ > 280 nm, dynamics proceed through
tunneling under the 1 1 ππ ∗ / 1 πσ ∗
O–H CI, in an analogous manner to phenol (see
Sect. 6.4.3). The left panel in Fig. 6.11(a) displays a representative H + velocity
map image (inset, t = 1.2 ns) and TKER spectra (t = 1 ps and 1.2 ns), in the
H tunneling regime. The 1 πσ ∗
O–H feature (centered at ∼ 5000 cm −1 ) observed by
1.2 ns in the TKER spectrum correlates to H-atoms formed through non-adiabatic
dissociation around the 1 πσ ∗
O–H /S 0 CI (Fig. 6.10(a), red arrows). A kinetic fit to
this transient returns a H-atom appearance timescale of ≥ 1 ns, in qualitative agreement with an upper limit of the H tunneling lifetime obtained from calculated 1-D
potentials using a simple BKW model (∼ 10 ns [80]). Upon decreasing the excitation wavelength to 280 > λ > 245 nm no H-atom signal is observed at either
low or high TKER. The origins of this are due to competition with O–CH 3 fission
dynamics, which is discussed in more detail below. Decreasing the wavelength further (≤ 245 nm) accesses the higher lying 2 1 ππ ∗ state, at which point coupling
onto the 1 πσ ∗
O–H state is reactivated (Fig. 6.11(b)). At these higher energies the
1 πσ ∗
O–H feature shifts to higher TKER (centered at ∼ 10000 cm −1 ) and is present
by 1 ps, but remains correlated to non-adiabatic dissociation through the 1 πσ ∗
O–H /S 0
CI. A fit to the signal transient of this feature in Fig. 6.11(b) provides an ultrafast
timescale of τ = 180 ± 30 fs for 1 πσ ∗
O–H governed O–H scission, following initial excitation to 2 1 ππ ∗ . In combination, these observations flag up a change in the
mechanism for coupling onto the 1 πσ ∗
O–H state, relative to the tunneling dynamics