

138
G.M. Roberts and V.G. Stavros
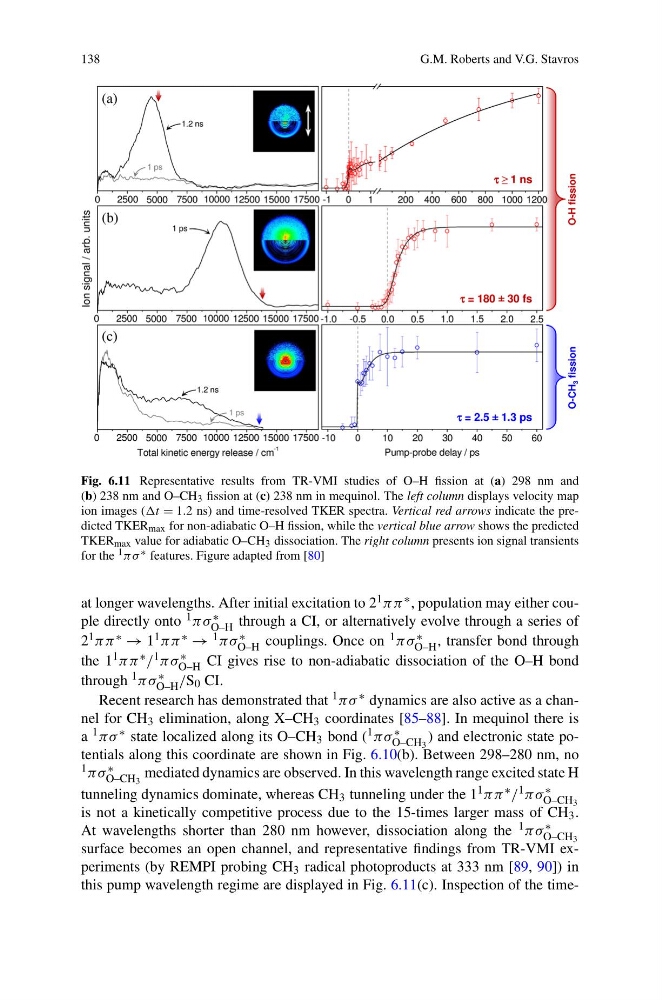
Fig. 6.11 Representative results from TR-VMI studies of O–H fission at (a) 298 nm and
(b) 238 nm and O–CH 3 fission at (c) 238 nm in mequinol. The left column displays velocity map
ion images (t = 1.2 ns) and time-resolved TKER spectra. Vertical red arrows indicate the predicted TKER max for non-adiabatic O–H fission, while the vertical blue arrow shows the predicted
TKER max value for adiabatic O–CH 3 dissociation. The right column presents ion signal transients
for the 1 πσ ∗ features. Figure adapted from [80]
at longer wavelengths. After initial excitation to 2 1 ππ ∗ , population may either couple directly onto 1 πσ ∗
O–H through a CI, or alternatively evolve through a series of
2 1 ππ ∗ → 1 1 ππ ∗ → 1 πσ ∗
O–H couplings. Once on 1 πσ ∗
O–H , transfer bond through
the 1 1 ππ ∗ / 1 πσ ∗
O–H CI gives rise to non-adiabatic dissociation of the O–H bond
through 1 πσ ∗
O–H /S 0 CI.
Recent research has demonstrated that 1 πσ ∗ dynamics are also active as a channel for CH 3 elimination, along X–CH 3 coordinates [85–88]. In mequinol there is
a 1 πσ ∗ state localized along its O–CH 3 bond ( 1 πσ ∗
O–CH 3
) and electronic state potentials along this coordinate are shown in Fig. 6.10(b). Between 298–280 nm, no
1 πσ ∗
O–CH 3
mediated dynamics are observed. In this wavelength range excited state H
tunneling dynamics dominate, whereas CH 3 tunneling under the 1 1 ππ ∗ / 1 πσ ∗
O–CH 3
is not a kinetically competitive process due to the 15-times larger mass of CH 3 .
At wavelengths shorter than 280 nm however, dissociation along the 1 πσ ∗
O–CH 3
surface becomes an open channel, and representative findings from TR-VMI experiments (by REMPI probing CH 3 radical photoproducts at 333 nm [89, 90]) in
this pump wavelength regime are displayed in Fig. 6.11(c). Inspection of the time-
G.M. Roberts and V.G. Stavros
Fig. 6.11 Representative results from TR-VMI studies of O–H fission at (a) 298 nm and
(b) 238 nm and O–CH 3 fission at (c) 238 nm in mequinol. The left column displays velocity map
ion images (t = 1.2 ns) and time-resolved TKER spectra. Vertical red arrows indicate the predicted TKER max for non-adiabatic O–H fission, while the vertical blue arrow shows the predicted
TKER max value for adiabatic O–CH 3 dissociation. The right column presents ion signal transients
for the 1 πσ ∗ features. Figure adapted from [80]
at longer wavelengths. After initial excitation to 2 1 ππ ∗ , population may either couple directly onto 1 πσ ∗
O–H through a CI, or alternatively evolve through a series of
2 1 ππ ∗ → 1 1 ππ ∗ → 1 πσ ∗
O–H couplings. Once on 1 πσ ∗
O–H , transfer bond through
the 1 1 ππ ∗ / 1 πσ ∗
O–H CI gives rise to non-adiabatic dissociation of the O–H bond
through 1 πσ ∗
O–H /S 0 CI.
Recent research has demonstrated that 1 πσ ∗ dynamics are also active as a channel for CH 3 elimination, along X–CH 3 coordinates [85–88]. In mequinol there is
a 1 πσ ∗ state localized along its O–CH 3 bond ( 1 πσ ∗
O–CH 3
) and electronic state potentials along this coordinate are shown in Fig. 6.10(b). Between 298–280 nm, no
1 πσ ∗
O–CH 3
mediated dynamics are observed. In this wavelength range excited state H
tunneling dynamics dominate, whereas CH 3 tunneling under the 1 1 ππ ∗ / 1 πσ ∗
O–CH 3
is not a kinetically competitive process due to the 15-times larger mass of CH 3 .
At wavelengths shorter than 280 nm however, dissociation along the 1 πσ ∗
O–CH 3
surface becomes an open channel, and representative findings from TR-VMI experiments (by REMPI probing CH 3 radical photoproducts at 333 nm [89, 90]) in
this pump wavelength regime are displayed in Fig. 6.11(c). Inspection of the time-