

6 Biomolecules, Photostability and 1 πσ ∗ States
135
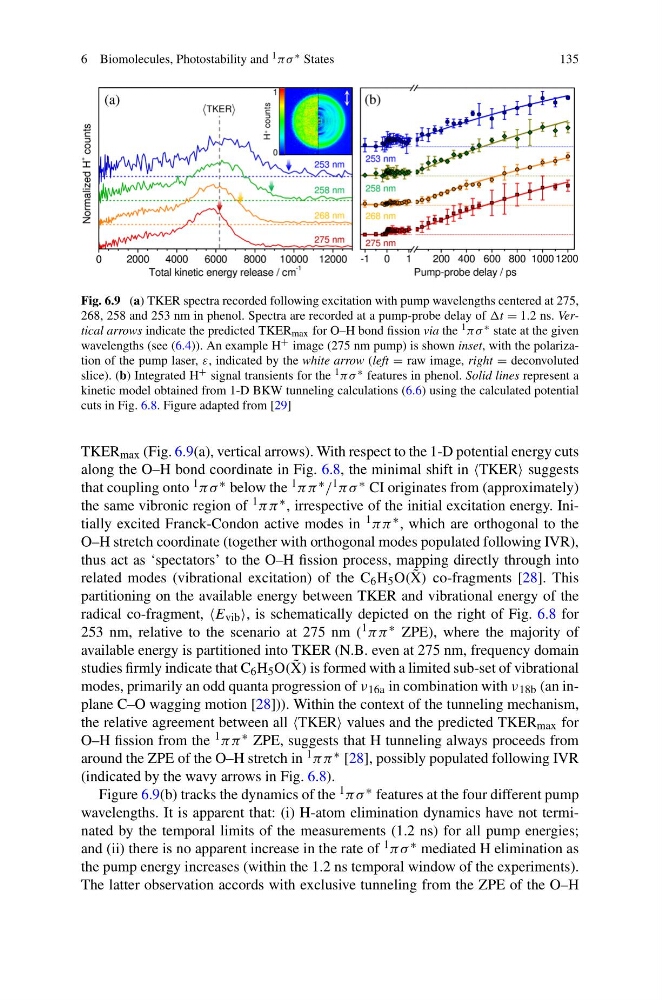
Fig. 6.9 (a) TKER spectra recorded following excitation with pump wavelengths centered at 275,
268, 258 and 253 nm in phenol. Spectra are recorded at a pump-probe delay of t = 1.2 ns. Vertical arrows indicate the predicted TKER max for O–H bond fission via the 1 πσ ∗ state at the given
wavelengths (see (6.4)). An example H + image (275 nm pump) is shown inset, with the polarization of the pump laser, ε, indicated by the white arrow (left = raw image, right = deconvoluted
slice). (b) Integrated H + signal transients for the 1 πσ ∗ features in phenol. Solid lines represent a
kinetic model obtained from 1-D BKW tunneling calculations (6.6) using the calculated potential
cuts in Fig. 6.8. Figure adapted from [29]
TKER max (Fig. 6.9(a), vertical arrows). With respect to the 1-D potential energy cuts
along the O–H bond coordinate in Fig. 6.8, the minimal shift in TKER suggests
that coupling onto 1 πσ ∗ below the 1 ππ ∗ / 1 πσ ∗ CI originates from (approximately)
the same vibronic region of 1 ππ ∗ , irrespective of the initial excitation energy. Initially excited Franck-Condon active modes in 1 ππ ∗ , which are orthogonal to the
O–H stretch coordinate (together with orthogonal modes populated following IVR),
thus act as ‘spectators’ to the O–H fission process, mapping directly through into
related modes (vibrational excitation) of the C 6 H 5 O( ˜
X) co-fragments [28]. This
partitioning on the available energy between TKER and vibrational energy of the
radical co-fragment, E vib , is schematically depicted on the right of Fig. 6.8 for
253 nm, relative to the scenario at 275 nm ( 1 ππ ∗ ZPE), where the majority of
available energy is partitioned into TKER (N.B. even at 275 nm, frequency domain
studies firmly indicate that C 6 H 5 O( ˜
X) is formed with a limited sub-set of vibrational
modes, primarily an odd quanta progression of ν 16a in combination with ν 18b (an inplane C–O wagging motion [28])). Within the context of the tunneling mechanism,
the relative agreement between all TKER values and the predicted TKER max for
O–H fission from the 1 ππ ∗ ZPE, suggests that H tunneling always proceeds from
around the ZPE of the O–H stretch in 1 ππ ∗ [28], possibly populated following IVR
(indicated by the wavy arrows in Fig. 6.8).
Figure 6.9(b) tracks the dynamics of the 1 πσ ∗ features at the four different pump
wavelengths. It is apparent that: (i) H-atom elimination dynamics have not terminated by the temporal limits of the measurements (1.2 ns) for all pump energies;
and (ii) there is no apparent increase in the rate of 1 πσ ∗ mediated H elimination as
the pump energy increases (within the 1.2 ns temporal window of the experiments).
The latter observation accords with exclusive tunneling from the ZPE of the O–H
135
Fig. 6.9 (a) TKER spectra recorded following excitation with pump wavelengths centered at 275,
268, 258 and 253 nm in phenol. Spectra are recorded at a pump-probe delay of t = 1.2 ns. Vertical arrows indicate the predicted TKER max for O–H bond fission via the 1 πσ ∗ state at the given
wavelengths (see (6.4)). An example H + image (275 nm pump) is shown inset, with the polarization of the pump laser, ε, indicated by the white arrow (left = raw image, right = deconvoluted
slice). (b) Integrated H + signal transients for the 1 πσ ∗ features in phenol. Solid lines represent a
kinetic model obtained from 1-D BKW tunneling calculations (6.6) using the calculated potential
cuts in Fig. 6.8. Figure adapted from [29]
TKER max (Fig. 6.9(a), vertical arrows). With respect to the 1-D potential energy cuts
along the O–H bond coordinate in Fig. 6.8, the minimal shift in TKER suggests
that coupling onto 1 πσ ∗ below the 1 ππ ∗ / 1 πσ ∗ CI originates from (approximately)
the same vibronic region of 1 ππ ∗ , irrespective of the initial excitation energy. Initially excited Franck-Condon active modes in 1 ππ ∗ , which are orthogonal to the
O–H stretch coordinate (together with orthogonal modes populated following IVR),
thus act as ‘spectators’ to the O–H fission process, mapping directly through into
related modes (vibrational excitation) of the C 6 H 5 O( ˜
X) co-fragments [28]. This
partitioning on the available energy between TKER and vibrational energy of the
radical co-fragment, E vib , is schematically depicted on the right of Fig. 6.8 for
253 nm, relative to the scenario at 275 nm ( 1 ππ ∗ ZPE), where the majority of
available energy is partitioned into TKER (N.B. even at 275 nm, frequency domain
studies firmly indicate that C 6 H 5 O( ˜
X) is formed with a limited sub-set of vibrational
modes, primarily an odd quanta progression of ν 16a in combination with ν 18b (an inplane C–O wagging motion [28])). Within the context of the tunneling mechanism,
the relative agreement between all TKER values and the predicted TKER max for
O–H fission from the 1 ππ ∗ ZPE, suggests that H tunneling always proceeds from
around the ZPE of the O–H stretch in 1 ππ ∗ [28], possibly populated following IVR
(indicated by the wavy arrows in Fig. 6.8).
Figure 6.9(b) tracks the dynamics of the 1 πσ ∗ features at the four different pump
wavelengths. It is apparent that: (i) H-atom elimination dynamics have not terminated by the temporal limits of the measurements (1.2 ns) for all pump energies;
and (ii) there is no apparent increase in the rate of 1 πσ ∗ mediated H elimination as
the pump energy increases (within the 1.2 ns temporal window of the experiments).
The latter observation accords with exclusive tunneling from the ZPE of the O–H