

134
G.M. Roberts and V.G. Stavros
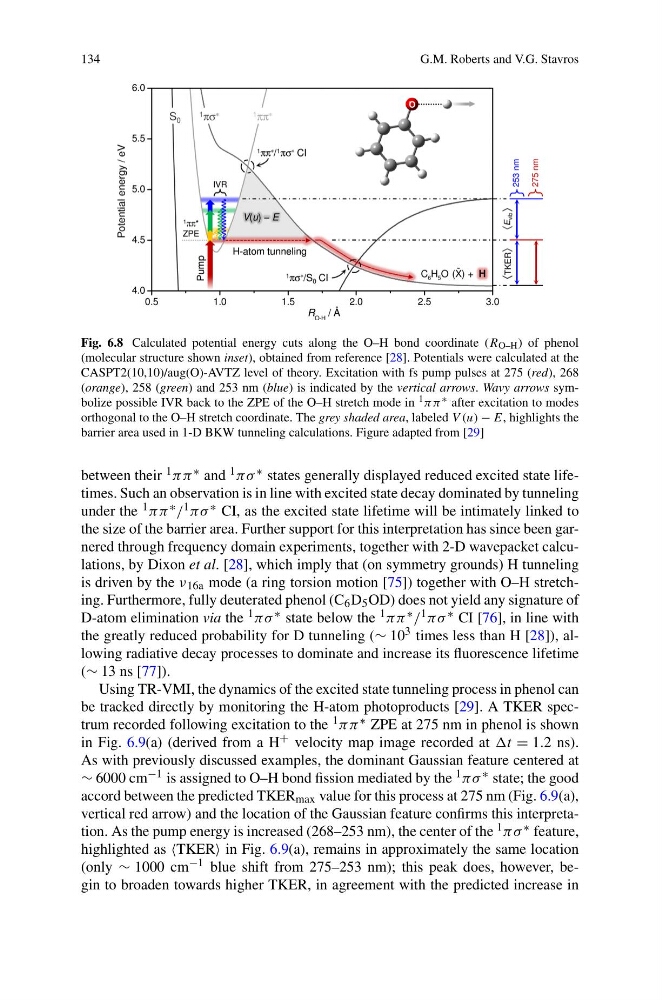
Fig. 6.8 Calculated potential energy cuts along the O–H bond coordinate (R O–H ) of phenol
(molecular structure shown inset), obtained from reference [28]. Potentials were calculated at the
CASPT2(10,10)/aug(O)-AVTZ level of theory. Excitation with fs pump pulses at 275 (red), 268
(orange), 258 (green) and 253 nm (blue) is indicated by the vertical arrows. Wavy arrows symbolize possible IVR back to the ZPE of the O–H stretch mode in 1 ππ ∗ after excitation to modes
orthogonal to the O–H stretch coordinate. The grey shaded area, labeled V (u) − E, highlights the
barrier area used in 1-D BKW tunneling calculations. Figure adapted from [29]
between their 1 ππ ∗ and 1 πσ ∗ states generally displayed reduced excited state lifetimes. Such an observation is in line with excited state decay dominated by tunneling
under the 1 ππ ∗ / 1 πσ ∗ CI, as the excited state lifetime will be intimately linked to
the size of the barrier area. Further support for this interpretation has since been garnered through frequency domain experiments, together with 2-D wavepacket calculations, by Dixon et al. [28], which imply that (on symmetry grounds) H tunneling
is driven by the ν 16a mode (a ring torsion motion [75]) together with O–H stretching. Furthermore, fully deuterated phenol (C 6 D 5 OD) does not yield any signature of
D-atom elimination via the 1 πσ ∗ state below the 1 ππ ∗ / 1 πσ ∗ CI [76], in line with
the greatly reduced probability for D tunneling (∼ 10 3 times less than H [28]), allowing radiative decay processes to dominate and increase its fluorescence lifetime
(∼ 13 ns [77]).
Using TR-VMI, the dynamics of the excited state tunneling process in phenol can
be tracked directly by monitoring the H-atom photoproducts [29]. A TKER spectrum recorded following excitation to the 1 ππ ∗ ZPE at 275 nm in phenol is shown
in Fig. 6.9(a) (derived from a H + velocity map image recorded at t = 1.2 ns).
As with previously discussed examples, the dominant Gaussian feature centered at
∼ 6000 cm −1 is assigned to O–H bond fission mediated by the 1 πσ ∗ state; the good
accord between the predicted TKER max value for this process at 275 nm (Fig. 6.9(a),
vertical red arrow) and the location of the Gaussian feature confirms this interpretation. As the pump energy is increased (268–253 nm), the center of the 1 πσ ∗ feature,
highlighted as TKER in Fig. 6.9(a), remains in approximately the same location
(only ∼ 1000 cm −1 blue shift from 275–253 nm); this peak does, however, begin to broaden towards higher TKER, in agreement with the predicted increase in
G.M. Roberts and V.G. Stavros
Fig. 6.8 Calculated potential energy cuts along the O–H bond coordinate (R O–H ) of phenol
(molecular structure shown inset), obtained from reference [28]. Potentials were calculated at the
CASPT2(10,10)/aug(O)-AVTZ level of theory. Excitation with fs pump pulses at 275 (red), 268
(orange), 258 (green) and 253 nm (blue) is indicated by the vertical arrows. Wavy arrows symbolize possible IVR back to the ZPE of the O–H stretch mode in 1 ππ ∗ after excitation to modes
orthogonal to the O–H stretch coordinate. The grey shaded area, labeled V (u) − E, highlights the
barrier area used in 1-D BKW tunneling calculations. Figure adapted from [29]
between their 1 ππ ∗ and 1 πσ ∗ states generally displayed reduced excited state lifetimes. Such an observation is in line with excited state decay dominated by tunneling
under the 1 ππ ∗ / 1 πσ ∗ CI, as the excited state lifetime will be intimately linked to
the size of the barrier area. Further support for this interpretation has since been garnered through frequency domain experiments, together with 2-D wavepacket calculations, by Dixon et al. [28], which imply that (on symmetry grounds) H tunneling
is driven by the ν 16a mode (a ring torsion motion [75]) together with O–H stretching. Furthermore, fully deuterated phenol (C 6 D 5 OD) does not yield any signature of
D-atom elimination via the 1 πσ ∗ state below the 1 ππ ∗ / 1 πσ ∗ CI [76], in line with
the greatly reduced probability for D tunneling (∼ 10 3 times less than H [28]), allowing radiative decay processes to dominate and increase its fluorescence lifetime
(∼ 13 ns [77]).
Using TR-VMI, the dynamics of the excited state tunneling process in phenol can
be tracked directly by monitoring the H-atom photoproducts [29]. A TKER spectrum recorded following excitation to the 1 ππ ∗ ZPE at 275 nm in phenol is shown
in Fig. 6.9(a) (derived from a H + velocity map image recorded at t = 1.2 ns).
As with previously discussed examples, the dominant Gaussian feature centered at
∼ 6000 cm −1 is assigned to O–H bond fission mediated by the 1 πσ ∗ state; the good
accord between the predicted TKER max value for this process at 275 nm (Fig. 6.9(a),
vertical red arrow) and the location of the Gaussian feature confirms this interpretation. As the pump energy is increased (268–253 nm), the center of the 1 πσ ∗ feature,
highlighted as TKER in Fig. 6.9(a), remains in approximately the same location
(only ∼ 1000 cm −1 blue shift from 275–253 nm); this peak does, however, begin to broaden towards higher TKER, in agreement with the predicted increase in