

112
R. Spesyvtsev et al.
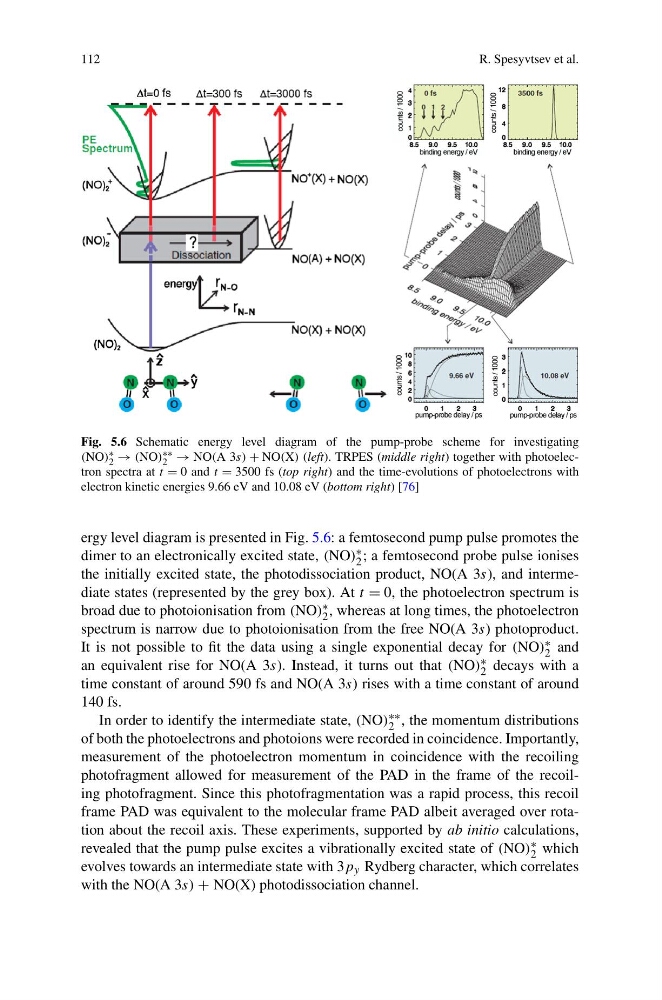
Fig. 5.6 Schematic energy level diagram of the pump-probe scheme for investigating
(NO) ∗
2 → (NO) ∗∗
2 → NO(A 3s) + NO(X) (left). TRPES (middle right) together with photoelectron spectra at t = 0 and t = 3500 fs (top right) and the time-evolutions of photoelectrons with
electron kinetic energies 9.66 eV and 10.08 eV (bottom right) [76]
ergy level diagram is presented in Fig. 5.6: a femtosecond pump pulse promotes the
dimer to an electronically excited state, (NO) ∗
2 ; a femtosecond probe pulse ionises
the initially excited state, the photodissociation product, NO(A 3s), and intermediate states (represented by the grey box). At t = 0, the photoelectron spectrum is
broad due to photoionisation from (NO) ∗
2 , whereas at long times, the photoelectron
spectrum is narrow due to photoionisation from the free NO(A 3s) photoproduct.
It is not possible to fit the data using a single exponential decay for (NO) ∗
2 and
an equivalent rise for NO(A 3s). Instead, it turns out that (NO) ∗
2 decays with a
time constant of around 590 fs and NO(A 3s) rises with a time constant of around
140 fs.
In order to identify the intermediate state, (NO) ∗∗
2 , the momentum distributions
of both the photoelectrons and photoions were recorded in coincidence. Importantly,
measurement of the photoelectron momentum in coincidence with the recoiling
photofragment allowed for measurement of the PAD in the frame of the recoiling photofragment. Since this photofragmentation was a rapid process, this recoil
frame PAD was equivalent to the molecular frame PAD albeit averaged over rotation about the recoil axis. These experiments, supported by ab initio calculations,
revealed that the pump pulse excites a vibrationally excited state of (NO) ∗
2 which
evolves towards an intermediate state with 3p y Rydberg character, which correlates
with the NO(A 3s) + NO(X) photodissociation channel.
R. Spesyvtsev et al.
Fig. 5.6 Schematic energy level diagram of the pump-probe scheme for investigating
(NO) ∗
2 → (NO) ∗∗
2 → NO(A 3s) + NO(X) (left). TRPES (middle right) together with photoelectron spectra at t = 0 and t = 3500 fs (top right) and the time-evolutions of photoelectrons with
electron kinetic energies 9.66 eV and 10.08 eV (bottom right) [76]
ergy level diagram is presented in Fig. 5.6: a femtosecond pump pulse promotes the
dimer to an electronically excited state, (NO) ∗
2 ; a femtosecond probe pulse ionises
the initially excited state, the photodissociation product, NO(A 3s), and intermediate states (represented by the grey box). At t = 0, the photoelectron spectrum is
broad due to photoionisation from (NO) ∗
2 , whereas at long times, the photoelectron
spectrum is narrow due to photoionisation from the free NO(A 3s) photoproduct.
It is not possible to fit the data using a single exponential decay for (NO) ∗
2 and
an equivalent rise for NO(A 3s). Instead, it turns out that (NO) ∗
2 decays with a
time constant of around 590 fs and NO(A 3s) rises with a time constant of around
140 fs.
In order to identify the intermediate state, (NO) ∗∗
2 , the momentum distributions
of both the photoelectrons and photoions were recorded in coincidence. Importantly,
measurement of the photoelectron momentum in coincidence with the recoiling
photofragment allowed for measurement of the PAD in the frame of the recoiling photofragment. Since this photofragmentation was a rapid process, this recoil
frame PAD was equivalent to the molecular frame PAD albeit averaged over rotation about the recoil axis. These experiments, supported by ab initio calculations,
revealed that the pump pulse excites a vibrationally excited state of (NO) ∗
2 which
evolves towards an intermediate state with 3p y Rydberg character, which correlates
with the NO(A 3s) + NO(X) photodissociation channel.