

110
R. Spesyvtsev et al.
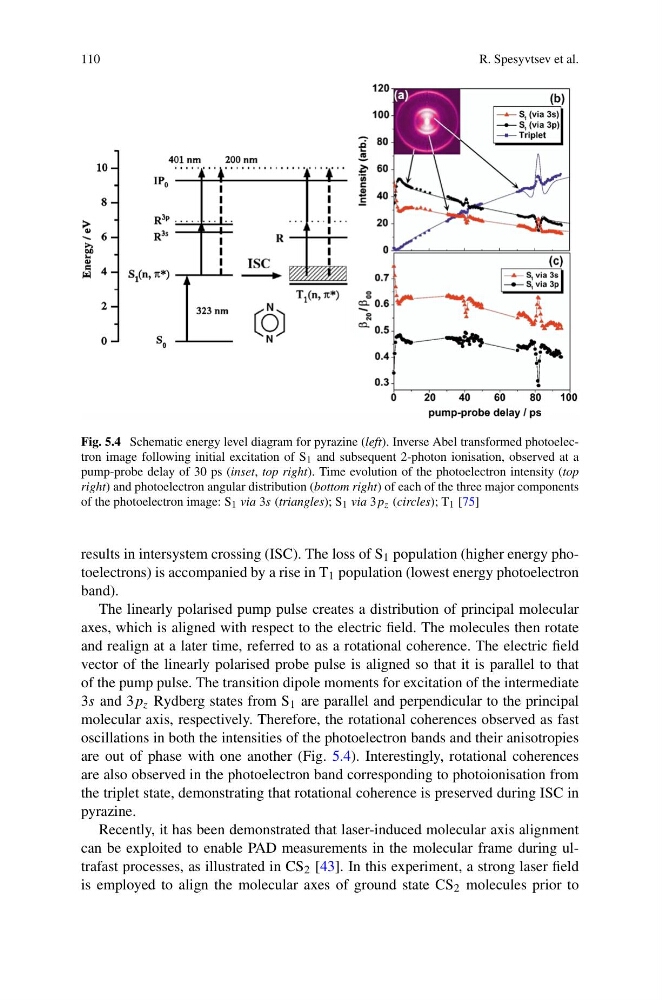
Fig. 5.4 Schematic energy level diagram for pyrazine (left). Inverse Abel transformed photoelectron image following initial excitation of S 1 and subsequent 2-photon ionisation, observed at a
pump-probe delay of 30 ps (inset, top right). Time evolution of the photoelectron intensity (top
right) and photoelectron angular distribution (bottom right) of each of the three major components
of the photoelectron image: S 1 via 3s (triangles); S 1 via 3p z (circles); T 1 [75]
results in intersystem crossing (ISC). The loss of S 1 population (higher energy photoelectrons) is accompanied by a rise in T 1 population (lowest energy photoelectron
band).
The linearly polarised pump pulse creates a distribution of principal molecular
axes, which is aligned with respect to the electric field. The molecules then rotate
and realign at a later time, referred to as a rotational coherence. The electric field
vector of the linearly polarised probe pulse is aligned so that it is parallel to that
of the pump pulse. The transition dipole moments for excitation of the intermediate
3s and 3p z Rydberg states from S 1 are parallel and perpendicular to the principal
molecular axis, respectively. Therefore, the rotational coherences observed as fast
oscillations in both the intensities of the photoelectron bands and their anisotropies
are out of phase with one another (Fig. 5.4). Interestingly, rotational coherences
are also observed in the photoelectron band corresponding to photoionisation from
the triplet state, demonstrating that rotational coherence is preserved during ISC in
pyrazine.
Recently, it has been demonstrated that laser-induced molecular axis alignment
can be exploited to enable PAD measurements in the molecular frame during ultrafast processes, as illustrated in CS 2 [43]. In this experiment, a strong laser field
is employed to align the molecular axes of ground state CS 2 molecules prior to
R. Spesyvtsev et al.
Fig. 5.4 Schematic energy level diagram for pyrazine (left). Inverse Abel transformed photoelectron image following initial excitation of S 1 and subsequent 2-photon ionisation, observed at a
pump-probe delay of 30 ps (inset, top right). Time evolution of the photoelectron intensity (top
right) and photoelectron angular distribution (bottom right) of each of the three major components
of the photoelectron image: S 1 via 3s (triangles); S 1 via 3p z (circles); T 1 [75]
results in intersystem crossing (ISC). The loss of S 1 population (higher energy photoelectrons) is accompanied by a rise in T 1 population (lowest energy photoelectron
band).
The linearly polarised pump pulse creates a distribution of principal molecular
axes, which is aligned with respect to the electric field. The molecules then rotate
and realign at a later time, referred to as a rotational coherence. The electric field
vector of the linearly polarised probe pulse is aligned so that it is parallel to that
of the pump pulse. The transition dipole moments for excitation of the intermediate
3s and 3p z Rydberg states from S 1 are parallel and perpendicular to the principal
molecular axis, respectively. Therefore, the rotational coherences observed as fast
oscillations in both the intensities of the photoelectron bands and their anisotropies
are out of phase with one another (Fig. 5.4). Interestingly, rotational coherences
are also observed in the photoelectron band corresponding to photoionisation from
the triplet state, demonstrating that rotational coherence is preserved during ISC in
pyrazine.
Recently, it has been demonstrated that laser-induced molecular axis alignment
can be exploited to enable PAD measurements in the molecular frame during ultrafast processes, as illustrated in CS 2 [43]. In this experiment, a strong laser field
is employed to align the molecular axes of ground state CS 2 molecules prior to