

4 Femtosecond Photodissociation Dynamics by Velocity Map Imaging
91
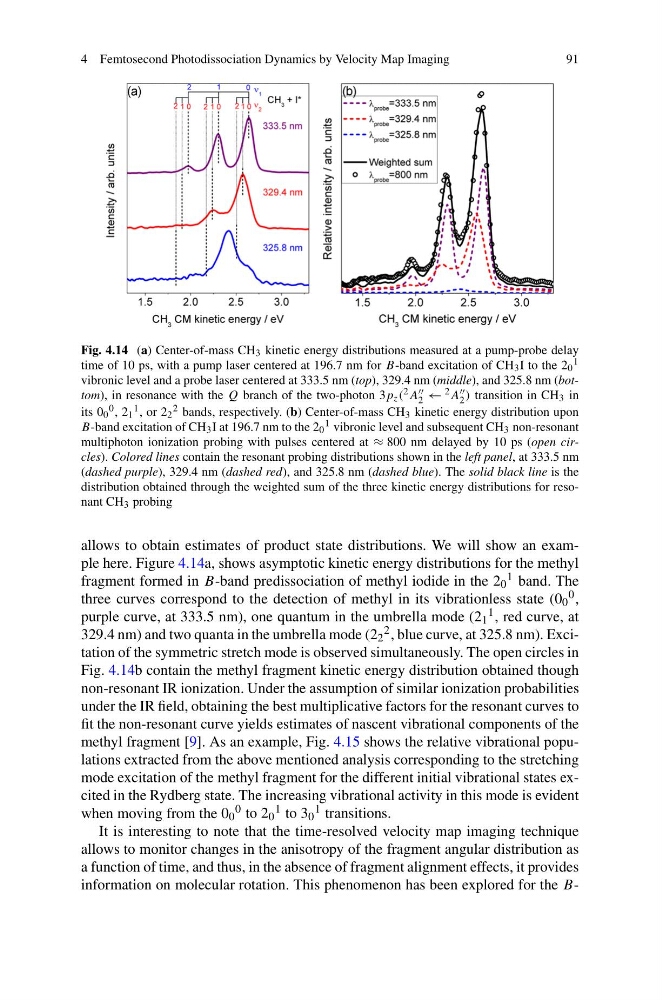
Fig. 4.14 (a) Center-of-mass CH 3 kinetic energy distributions measured at a pump-probe delay
time of 10 ps, with a pump laser centered at 196.7 nm for B-band excitation of CH 3 I to the 2 0
1
vibronic level and a probe laser centered at 333.5 nm (top), 329.4 nm (middle), and 325.8 nm (bottom), in resonance with the Q branch of the two-photon 3p z ( 2 A
2 ← 2 A
2 ) transition in CH 3 in
its 0 0
0 , 2 1
1 , or 2 2
2 bands, respectively. (b) Center-of-mass CH 3 kinetic energy distribution upon
B-band excitation of CH 3 I at 196.7 nm to the 2 0
1 vibronic level and subsequent CH 3 non-resonant
multiphoton ionization probing with pulses centered at ≈ 800 nm delayed by 10 ps (open circles). Colored lines contain the resonant probing distributions shown in the left panel, at 333.5 nm
(dashed purple), 329.4 nm (dashed red), and 325.8 nm (dashed blue). The solid black line is the
distribution obtained through the weighted sum of the three kinetic energy distributions for resonant CH 3 probing
allows to obtain estimates of product state distributions. We will show an example here. Figure 4.14a, shows asymptotic kinetic energy distributions for the methyl
fragment formed in B-band predissociation of methyl iodide in the 2 0
1 band. The
three curves correspond to the detection of methyl in its vibrationless state (0 0
0 ,
purple curve, at 333.5 nm), one quantum in the umbrella mode (2 1
1 , red curve, at
329.4 nm) and two quanta in the umbrella mode (2 2
2 , blue curve, at 325.8 nm). Excitation of the symmetric stretch mode is observed simultaneously. The open circles in
Fig. 4.14b contain the methyl fragment kinetic energy distribution obtained though
non-resonant IR ionization. Under the assumption of similar ionization probabilities
under the IR field, obtaining the best multiplicative factors for the resonant curves to
fit the non-resonant curve yields estimates of nascent vibrational components of the
methyl fragment [9]. As an example, Fig. 4.15 shows the relative vibrational populations extracted from the above mentioned analysis corresponding to the stretching
mode excitation of the methyl fragment for the different initial vibrational states excited in the Rydberg state. The increasing vibrational activity in this mode is evident
when moving from the 0 0
0 to 2 0
1 to 3 0
1 transitions.
It is interesting to note that the time-resolved velocity map imaging technique
allows to monitor changes in the anisotropy of the fragment angular distribution as
a function of time, and thus, in the absence of fragment alignment effects, it provides
information on molecular rotation. This phenomenon has been explored for the B-
91
Fig. 4.14 (a) Center-of-mass CH 3 kinetic energy distributions measured at a pump-probe delay
time of 10 ps, with a pump laser centered at 196.7 nm for B-band excitation of CH 3 I to the 2 0
1
vibronic level and a probe laser centered at 333.5 nm (top), 329.4 nm (middle), and 325.8 nm (bottom), in resonance with the Q branch of the two-photon 3p z ( 2 A
2 ← 2 A
2 ) transition in CH 3 in
its 0 0
0 , 2 1
1 , or 2 2
2 bands, respectively. (b) Center-of-mass CH 3 kinetic energy distribution upon
B-band excitation of CH 3 I at 196.7 nm to the 2 0
1 vibronic level and subsequent CH 3 non-resonant
multiphoton ionization probing with pulses centered at ≈ 800 nm delayed by 10 ps (open circles). Colored lines contain the resonant probing distributions shown in the left panel, at 333.5 nm
(dashed purple), 329.4 nm (dashed red), and 325.8 nm (dashed blue). The solid black line is the
distribution obtained through the weighted sum of the three kinetic energy distributions for resonant CH 3 probing
allows to obtain estimates of product state distributions. We will show an example here. Figure 4.14a, shows asymptotic kinetic energy distributions for the methyl
fragment formed in B-band predissociation of methyl iodide in the 2 0
1 band. The
three curves correspond to the detection of methyl in its vibrationless state (0 0
0 ,
purple curve, at 333.5 nm), one quantum in the umbrella mode (2 1
1 , red curve, at
329.4 nm) and two quanta in the umbrella mode (2 2
2 , blue curve, at 325.8 nm). Excitation of the symmetric stretch mode is observed simultaneously. The open circles in
Fig. 4.14b contain the methyl fragment kinetic energy distribution obtained though
non-resonant IR ionization. Under the assumption of similar ionization probabilities
under the IR field, obtaining the best multiplicative factors for the resonant curves to
fit the non-resonant curve yields estimates of nascent vibrational components of the
methyl fragment [9]. As an example, Fig. 4.15 shows the relative vibrational populations extracted from the above mentioned analysis corresponding to the stretching
mode excitation of the methyl fragment for the different initial vibrational states excited in the Rydberg state. The increasing vibrational activity in this mode is evident
when moving from the 0 0
0 to 2 0
1 to 3 0
1 transitions.
It is interesting to note that the time-resolved velocity map imaging technique
allows to monitor changes in the anisotropy of the fragment angular distribution as
a function of time, and thus, in the absence of fragment alignment effects, it provides
information on molecular rotation. This phenomenon has been explored for the B-