

90
R. de Nalda et al.
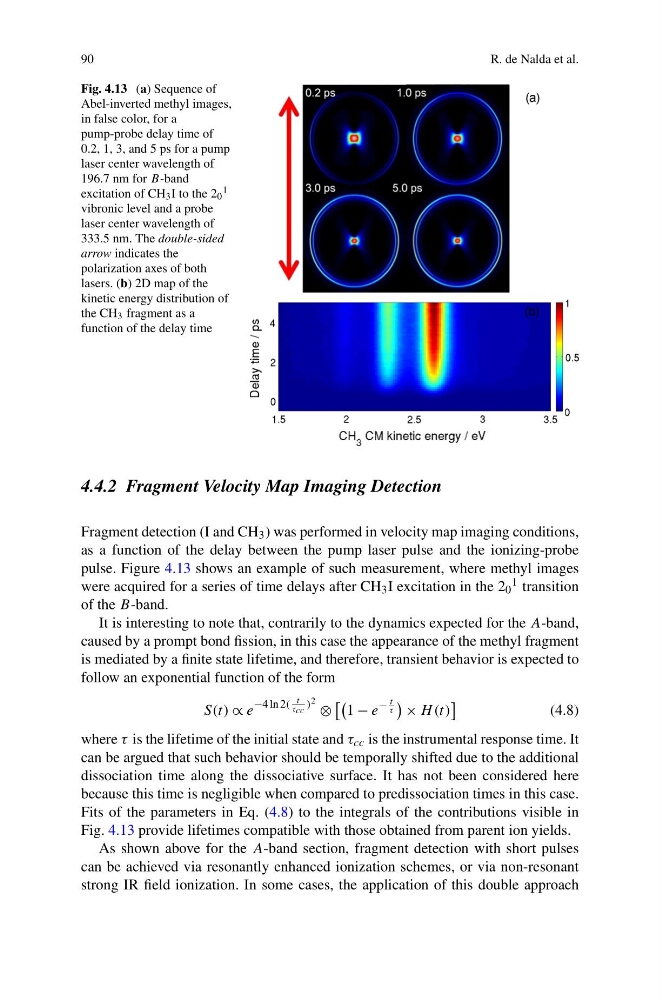
Fig. 4.13 (a) Sequence of
Abel-inverted methyl images,
in false color, for a
pump-probe delay time of
0.2, 1, 3, and 5 ps for a pump
laser center wavelength of
196.7 nm for B-band
excitation of CH 3 I to the 2 0
1
vibronic level and a probe
laser center wavelength of
333.5 nm. The double-sided
arrow indicates the
polarization axes of both
lasers. (b) 2D map of the
kinetic energy distribution of
the CH 3 fragment as a
function of the delay time
4.4.2 Fragment Velocity Map Imaging Detection
Fragment detection (I and CH 3 ) was performed in velocity map imaging conditions,
as a function of the delay between the pump laser pulse and the ionizing-probe
pulse. Figure 4.13 shows an example of such measurement, where methyl images
were acquired for a series of time delays after CH 3 I excitation in the 2 0
1 transition
of the B-band.
It is interesting to note that, contrarily to the dynamics expected for the A-band,
caused by a prompt bond fission, in this case the appearance of the methyl fragment
is mediated by a finite state lifetime, and therefore, transient behavior is expected to
follow an exponential function of the form
S(t) ∝ e
−4 ln 2(
t
τcc ) 2 ⊗
1 − e
−
t
τ
× H (t)
(4.8)
where τ is the lifetime of the initial state and τ cc is the instrumental response time. It
can be argued that such behavior should be temporally shifted due to the additional
dissociation time along the dissociative surface. It has not been considered here
because this time is negligible when compared to predissociation times in this case.
Fits of the parameters in Eq. (4.8) to the integrals of the contributions visible in
Fig. 4.13 provide lifetimes compatible with those obtained from parent ion yields.
As shown above for the A-band section, fragment detection with short pulses
can be achieved via resonantly enhanced ionization schemes, or via non-resonant
strong IR field ionization. In some cases, the application of this double approach
R. de Nalda et al.
Fig. 4.13 (a) Sequence of
Abel-inverted methyl images,
in false color, for a
pump-probe delay time of
0.2, 1, 3, and 5 ps for a pump
laser center wavelength of
196.7 nm for B-band
excitation of CH 3 I to the 2 0
1
vibronic level and a probe
laser center wavelength of
333.5 nm. The double-sided
arrow indicates the
polarization axes of both
lasers. (b) 2D map of the
kinetic energy distribution of
the CH 3 fragment as a
function of the delay time
4.4.2 Fragment Velocity Map Imaging Detection
Fragment detection (I and CH 3 ) was performed in velocity map imaging conditions,
as a function of the delay between the pump laser pulse and the ionizing-probe
pulse. Figure 4.13 shows an example of such measurement, where methyl images
were acquired for a series of time delays after CH 3 I excitation in the 2 0
1 transition
of the B-band.
It is interesting to note that, contrarily to the dynamics expected for the A-band,
caused by a prompt bond fission, in this case the appearance of the methyl fragment
is mediated by a finite state lifetime, and therefore, transient behavior is expected to
follow an exponential function of the form
S(t) ∝ e
−4 ln 2(
t
τcc ) 2 ⊗
1 − e
−
t
τ
× H (t)
(4.8)
where τ is the lifetime of the initial state and τ cc is the instrumental response time. It
can be argued that such behavior should be temporally shifted due to the additional
dissociation time along the dissociative surface. It has not been considered here
because this time is negligible when compared to predissociation times in this case.
Fits of the parameters in Eq. (4.8) to the integrals of the contributions visible in
Fig. 4.13 provide lifetimes compatible with those obtained from parent ion yields.
As shown above for the A-band section, fragment detection with short pulses
can be achieved via resonantly enhanced ionization schemes, or via non-resonant
strong IR field ionization. In some cases, the application of this double approach