

4 Femtosecond Photodissociation Dynamics by Velocity Map Imaging
89
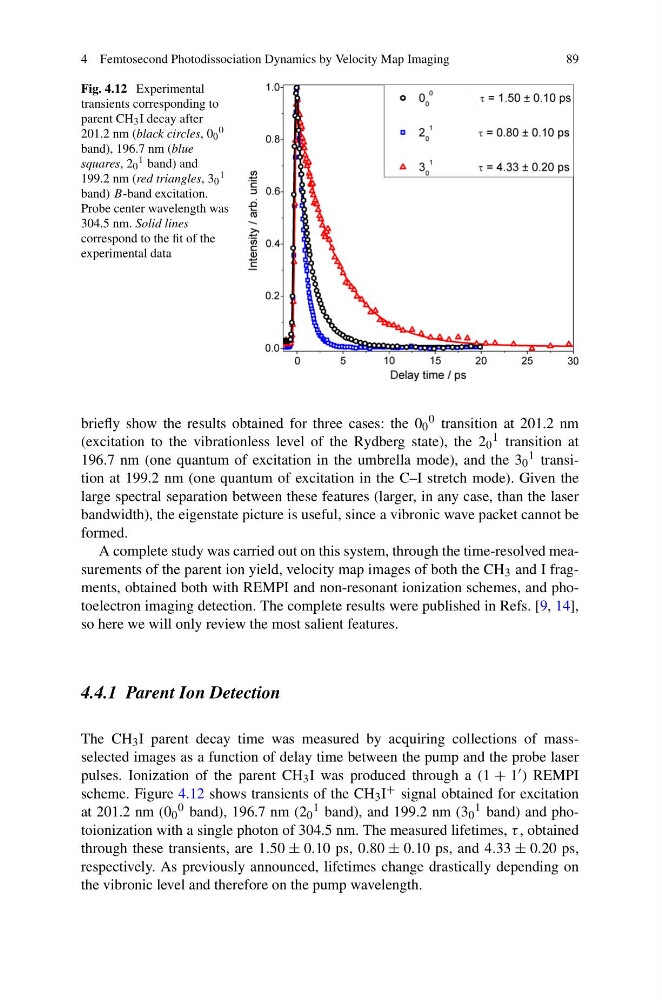
Fig. 4.12 Experimental
transients corresponding to
parent CH 3 I decay after
201.2 nm (black circles, 0 0
0
band), 196.7 nm (blue
squares, 2 0
1 band) and
199.2 nm (red triangles, 3 0
1
band) B-band excitation.
Probe center wavelength was
304.5 nm. Solid lines
correspond to the fit of the
experimental data
briefly show the results obtained for three cases: the 0 0
0 transition at 201.2 nm
(excitation to the vibrationless level of the Rydberg state), the 2 0
1 transition at
196.7 nm (one quantum of excitation in the umbrella mode), and the 3 0
1 transition at 199.2 nm (one quantum of excitation in the C–I stretch mode). Given the
large spectral separation between these features (larger, in any case, than the laser
bandwidth), the eigenstate picture is useful, since a vibronic wave packet cannot be
formed.
A complete study was carried out on this system, through the time-resolved measurements of the parent ion yield, velocity map images of both the CH 3 and I fragments, obtained both with REMPI and non-resonant ionization schemes, and photoelectron imaging detection. The complete results were published in Refs. [9, 14],
so here we will only review the most salient features.
4.4.1 Parent Ion Detection
The CH 3 I parent decay time was measured by acquiring collections of massselected images as a function of delay time between the pump and the probe laser
pulses. Ionization of the parent CH 3 I was produced through a (1 + 1 ) REMPI
scheme. Figure 4.12 shows transients of the CH 3 I + signal obtained for excitation
at 201.2 nm (0 0
0 band), 196.7 nm (2 0
1 band), and 199.2 nm (3 0
1 band) and photoionization with a single photon of 304.5 nm. The measured lifetimes, τ , obtained
through these transients, are 1.50 ± 0.10 ps, 0.80 ± 0.10 ps, and 4.33 ± 0.20 ps,
respectively. As previously announced, lifetimes change drastically depending on
the vibronic level and therefore on the pump wavelength.
89
Fig. 4.12 Experimental
transients corresponding to
parent CH 3 I decay after
201.2 nm (black circles, 0 0
0
band), 196.7 nm (blue
squares, 2 0
1 band) and
199.2 nm (red triangles, 3 0
1
band) B-band excitation.
Probe center wavelength was
304.5 nm. Solid lines
correspond to the fit of the
experimental data
briefly show the results obtained for three cases: the 0 0
0 transition at 201.2 nm
(excitation to the vibrationless level of the Rydberg state), the 2 0
1 transition at
196.7 nm (one quantum of excitation in the umbrella mode), and the 3 0
1 transition at 199.2 nm (one quantum of excitation in the C–I stretch mode). Given the
large spectral separation between these features (larger, in any case, than the laser
bandwidth), the eigenstate picture is useful, since a vibronic wave packet cannot be
formed.
A complete study was carried out on this system, through the time-resolved measurements of the parent ion yield, velocity map images of both the CH 3 and I fragments, obtained both with REMPI and non-resonant ionization schemes, and photoelectron imaging detection. The complete results were published in Refs. [9, 14],
so here we will only review the most salient features.
4.4.1 Parent Ion Detection
The CH 3 I parent decay time was measured by acquiring collections of massselected images as a function of delay time between the pump and the probe laser
pulses. Ionization of the parent CH 3 I was produced through a (1 + 1 ) REMPI
scheme. Figure 4.12 shows transients of the CH 3 I + signal obtained for excitation
at 201.2 nm (0 0
0 band), 196.7 nm (2 0
1 band), and 199.2 nm (3 0
1 band) and photoionization with a single photon of 304.5 nm. The measured lifetimes, τ , obtained
through these transients, are 1.50 ± 0.10 ps, 0.80 ± 0.10 ps, and 4.33 ± 0.20 ps,
respectively. As previously announced, lifetimes change drastically depending on
the vibronic level and therefore on the pump wavelength.