

92
R. de Nalda et al.
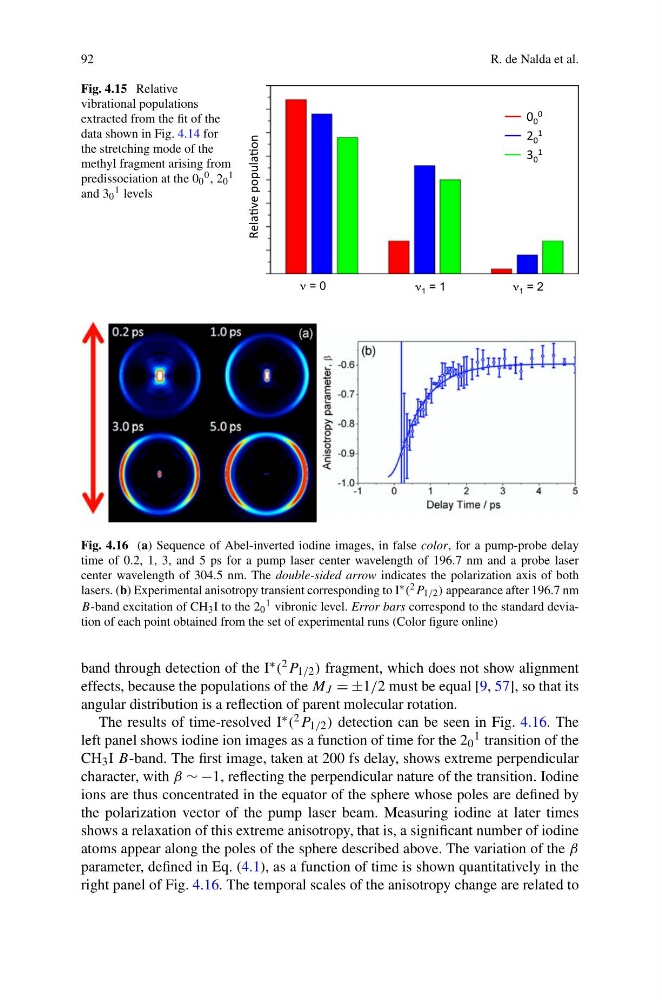
Fig. 4.15 Relative
vibrational populations
extracted from the fit of the
data shown in Fig. 4.14 for
the stretching mode of the
methyl fragment arising from
predissociation at the 0 0
0 , 2 0
1
and 3 0
1 levels
Fig. 4.16 (a) Sequence of Abel-inverted iodine images, in false color, for a pump-probe delay
time of 0.2, 1, 3, and 5 ps for a pump laser center wavelength of 196.7 nm and a probe laser
center wavelength of 304.5 nm. The double-sided arrow indicates the polarization axis of both
lasers. (b) Experimental anisotropy transient corresponding to I ∗ ( 2 P 1/2 ) appearance after 196.7 nm
B-band excitation of CH 3 I to the 2 0
1 vibronic level. Error bars correspond to the standard deviation of each point obtained from the set of experimental runs (Color figure online)
band through detection of the I ∗ ( 2 P 1/2 ) fragment, which does not show alignment
effects, because the populations of the M J = ±1/2 must be equal [9, 57], so that its
angular distribution is a reflection of parent molecular rotation.
The results of time-resolved I ∗ ( 2 P 1/2 ) detection can be seen in Fig. 4.16. The
left panel shows iodine ion images as a function of time for the 2 0
1 transition of the
CH 3 I B-band. The first image, taken at 200 fs delay, shows extreme perpendicular
character, with β ∼ −1, reflecting the perpendicular nature of the transition. Iodine
ions are thus concentrated in the equator of the sphere whose poles are defined by
the polarization vector of the pump laser beam. Measuring iodine at later times
shows a relaxation of this extreme anisotropy, that is, a significant number of iodine
atoms appear along the poles of the sphere described above. The variation of the β
parameter, defined in Eq. (4.1), as a function of time is shown quantitatively in the
right panel of Fig. 4.16. The temporal scales of the anisotropy change are related to
R. de Nalda et al.
Fig. 4.15 Relative
vibrational populations
extracted from the fit of the
data shown in Fig. 4.14 for
the stretching mode of the
methyl fragment arising from
predissociation at the 0 0
0 , 2 0
1
and 3 0
1 levels
Fig. 4.16 (a) Sequence of Abel-inverted iodine images, in false color, for a pump-probe delay
time of 0.2, 1, 3, and 5 ps for a pump laser center wavelength of 196.7 nm and a probe laser
center wavelength of 304.5 nm. The double-sided arrow indicates the polarization axis of both
lasers. (b) Experimental anisotropy transient corresponding to I ∗ ( 2 P 1/2 ) appearance after 196.7 nm
B-band excitation of CH 3 I to the 2 0
1 vibronic level. Error bars correspond to the standard deviation of each point obtained from the set of experimental runs (Color figure online)
band through detection of the I ∗ ( 2 P 1/2 ) fragment, which does not show alignment
effects, because the populations of the M J = ±1/2 must be equal [9, 57], so that its
angular distribution is a reflection of parent molecular rotation.
The results of time-resolved I ∗ ( 2 P 1/2 ) detection can be seen in Fig. 4.16. The
left panel shows iodine ion images as a function of time for the 2 0
1 transition of the
CH 3 I B-band. The first image, taken at 200 fs delay, shows extreme perpendicular
character, with β ∼ −1, reflecting the perpendicular nature of the transition. Iodine
ions are thus concentrated in the equator of the sphere whose poles are defined by
the polarization vector of the pump laser beam. Measuring iodine at later times
shows a relaxation of this extreme anisotropy, that is, a significant number of iodine
atoms appear along the poles of the sphere described above. The variation of the β
parameter, defined in Eq. (4.1), as a function of time is shown quantitatively in the
right panel of Fig. 4.16. The temporal scales of the anisotropy change are related to